
5.7

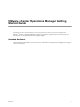

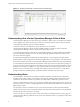
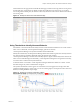
Table Of Contents
- VMware vCenter Operations Manager Getting Started Guide
- Contents
- VMware vCenter Operations Manager Getting Started Guide
- Introducing Custom User Interface Features and Concepts
- Introducing Common Tasks
- Logging In and Using vCenter Operations Manager
- Monitoring Day-to-Day Operations
- Handling Alerts
- Optimizing Your Resources
- Designing Your Workspace
- Using and Configuring Widgets
- Edit a Widget Configuration
- Supported Widget Interactions
- Configure Widget Interactions
- Advanced Health Tree Widget
- Alerts Widget
- Application Detail Widget
- Application Overview Widget
- Configuration Overview Widget
- Custom Relationship Widget
- Data Distribution Analysis Widget
- Generic Scoreboard Widget
- GEO Widget
- Health Status Widget
- Health Tree Widget
- Health-Workload Scoreboard Widget
- Heat Map Widget
- Mashup Charts Widget
- Metric Graph Widget
- Metric Graph (Rolling View) Widget
- Metric Selector Widget
- Metric Sparklines Widget
- Metric Weather Map Widget
- Resources Widget
- Root Cause Ranking Widget
- Tag Selector Widget
- Text Widget
- Top-N Analysis Widget
- VC Relationship Widget
- VC Relationship (Planning) Widget
- Define Metric Sets for a Widget
- Index

On the Alerts Overview page, the list on the left side of the page contains resource tags and resource tag values
and the right pane contains alerts. By default, the alert list includes alerts for all resources. If you select a
resource
tag value in the left pane, the alert list contains only the alerts for the resources that have the selected
resource tag value.
Figure 1-2. Example of Alerts on the Alerts Overview Page
Using Thresholds to Identify Abnormal Behavior
A
threshold is a value that marks the boundary between normal and abnormal behavior for a metric. When a
metric crosses a threshold, vCenter Operations Manager generates an anomaly.
vCenter Operations Manager uses dynamic thresholds and hard thresholds.
With dynamic thresholds, vCenter Operations Manager determines whether to generate an anomaly based on
how often a metric has violated its thresholds and by the amount of the violation.
vCenter Operations Manager calculates and continually adjusts a degree of abnormality for the metric. If the
metric value is within this degree of abnormality, vCenter Operations Manager does not generate an anomaly,
even if the value is outside of the dynamic threshold.
A hard threshold is a value that a vCenter Operations Manager administrator defines for a metric. A hard
threshold changes only when an administrator changes it.
The dynamic threshold for a metric appears as a shaded area in a metric graph. Out-of-range values that
generated anomalies appear as yellow areas. You can view metric graphs in several places in the Custom user
interface, including the Metric Graph widget.
Figure 1-3. Example of a Dynamic Threshold for a Metric
Chapter 1 Introducing Custom User Interface Features and Concepts
VMware, Inc. 9