
5.7
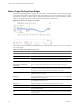
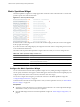
Table Of Contents
- VMware vCenter Operations Manager Getting Started Guide
- Contents
- VMware vCenter Operations Manager Getting Started Guide
- Introducing Custom User Interface Features and Concepts
- Introducing Common Tasks
- Logging In and Using vCenter Operations Manager
- Monitoring Day-to-Day Operations
- Handling Alerts
- Optimizing Your Resources
- Designing Your Workspace
- Using and Configuring Widgets
- Edit a Widget Configuration
- Supported Widget Interactions
- Configure Widget Interactions
- Advanced Health Tree Widget
- Alerts Widget
- Application Detail Widget
- Application Overview Widget
- Configuration Overview Widget
- Custom Relationship Widget
- Data Distribution Analysis Widget
- Generic Scoreboard Widget
- GEO Widget
- Health Status Widget
- Health Tree Widget
- Health-Workload Scoreboard Widget
- Heat Map Widget
- Mashup Charts Widget
- Metric Graph Widget
- Metric Graph (Rolling View) Widget
- Metric Selector Widget
- Metric Sparklines Widget
- Metric Weather Map Widget
- Resources Widget
- Root Cause Ranking Widget
- Tag Selector Widget
- Text Widget
- Top-N Analysis Widget
- VC Relationship Widget
- VC Relationship (Planning) Widget
- Define Metric Sets for a Widget
- Index

Table 4-9. Individual Graph Icons
Icon Description
Data Source Point to this icon to see the name of the data source, or adapter instance, for the metric.
For super metrics, the name is vCenter Operations Manager.
Show Correlated Metrics Appears only if vCenter Operations Manager determines that the behavior or anomalies
of other metrics are correlated to this metric. When you click this icon, a pop-up window
opens that shows the correlated metrics, including the resource, the metric name, and the
percentage of correlation. You can also display a column that shows the type of correlation,
either Anomaly, in which the anomalies of the metrics are correlated, or Behavior, in which
the behavior of the metrics is correlated. If the widget is not in self-provider mode, you
can select a correlated metric to add it to the widget display.
Save a Chart Snapshot Downloads the current graph image as a PNG file, which you can display or save.
Save a Fullscreen Snapshot Downloads the current graph image as a full-page PNG file, which you can display or
save.
NOTE For both snapshots, the default file name contains the resource, attribute group,
and metric name.
Download tab-separated data Downloads the data points currently shown on the graph to a tab-separated CSV file. Each
file includes the resource name and metric name and, for each value, date and time of the
collected metric, the value, and the lower and upper bounds of dynamic thresholds. You
can open or save the file.
Move Down Moves the graph down one position.
Move Up Moves the graph up one position.
Close Removes the graph.
Configure the Metric Graph Widget
You can select the metrics that the Metric Graph widget shows by editing the widget configuration.
You
can also configure other widgets to provide metric selections to the Metric Graph widget. See “Configure
Widget Interactions,” on page 57.
To define a fixed set of metrics for the widget to draw when you select a particular resource, see “Define Metric
Sets for a Widget,” on page 104.
Prerequisites
n
Verify that you have the necessary access rights to perform this task. Your vCenter Operations Manager
administrator can tell you which actions you can perform.
n
Open the Edit Widget window for the Metric Graph widget. See “Edit a Widget Configuration,” on
page 52.
Procedure
1 Set Self Provider to On to define metric selections in the widget configuration.
2 (Optional) Select one or more tag values in the Resources-Tags pane to filter the resources that appear on
the List tab.
You can use icons on the toolbar at the top of the list to collapse, expand, and deselect all of the tags in the
list.
When you select more than one value for the same tag, the list includes resources that have either value.
When you select values for two or more tags, the list includes only resources that have all of the values
that you select. When you click the Invert Result icon, the list includes only resources that do not match
the tag values that you select.
VMware vCenter Operations Manager Getting Started Guide
84 VMware, Inc.