
5.7
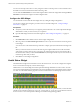
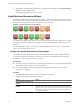
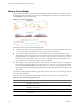
Table Of Contents
- VMware vCenter Operations Manager Getting Started Guide
- Contents
- VMware vCenter Operations Manager Getting Started Guide
- Introducing Custom User Interface Features and Concepts
- Introducing Common Tasks
- Logging In and Using vCenter Operations Manager
- Monitoring Day-to-Day Operations
- Handling Alerts
- Optimizing Your Resources
- Designing Your Workspace
- Using and Configuring Widgets
- Edit a Widget Configuration
- Supported Widget Interactions
- Configure Widget Interactions
- Advanced Health Tree Widget
- Alerts Widget
- Application Detail Widget
- Application Overview Widget
- Configuration Overview Widget
- Custom Relationship Widget
- Data Distribution Analysis Widget
- Generic Scoreboard Widget
- GEO Widget
- Health Status Widget
- Health Tree Widget
- Health-Workload Scoreboard Widget
- Heat Map Widget
- Mashup Charts Widget
- Metric Graph Widget
- Metric Graph (Rolling View) Widget
- Metric Selector Widget
- Metric Sparklines Widget
- Metric Weather Map Widget
- Resources Widget
- Root Cause Ranking Widget
- Tag Selector Widget
- Text Widget
- Top-N Analysis Widget
- VC Relationship Widget
- VC Relationship (Planning) Widget
- Define Metric Sets for a Widget
- Index

Configure the Heat Map Widget
The Heat Map widget contains graphical indicators that show the current value of two selected attributes for
resources that belong to tag values that you select.
You
can configure the widget to show different combinations of data, and you can save multiple configurations
for the widget. You use the Configuration drop-down menu on the toolbar at the top of the Heat Map widget
to select the widget configuration to use.
You can also configure other widgets to provide a resource to the Heat Map widget. See “Configure Widget
Interactions,” on page 57.
Prerequisites
n
Verify that you have the necessary access rights to perform this task. Your vCenter Operations Manager
administrator can tell you which actions you can perform.
n
Open the Edit Widget window for the Heat Map widget. See “Edit a Widget Configuration,” on
page 52.
Procedure
1 Set Self Provider to On to define a resource in the widget configuration.
2 Select the tag to use for first-level grouping of the resources from the Group By drop-down menu.
If a selected resource does not have a value for this tag, it appears in a group called Other.
3 Select the tag to use to separate the resources into subgroups from the Then By drop-down menu.
If a selected resource does not have a value for this tag, it appears in a subgroup called Other.
4 Select a Mode option.
Option Description
Instance
Track all instances of a metric for a resource with a separate rectangle for
each metric.
General
Pick an individual instance of a metric for each resource and track only that
metric.
5
If you selected General mode, select the attribute to use to set the size of the rectangle for each resource
in the Size By list and the attribute to use to determine the color of the rectangle for each resource in the
Color By list.
Resources that have higher values for the Size By attribute have larger areas of the widget display. You
can also select fixed-size rectangles. The color varies between the colors you set based on the value of the
Color By attribute.
In most cases, the attribute lists include only metrics that vCenter Operations Manager generates. If you
select a resource kind, the list shows all of the attributes that are defined for the resource kind.
6 To track metrics only for resources of a particular kind, select the resource kind from the Resource
Kinds drop-down menu.
7 If you selected Instance mode, select an attribute kind from the Attribute Kinds list.
The attribute kind determines the color of the rectangle for each resource.
VMware vCenter Operations Manager Getting Started Guide
78 VMware, Inc.