
5.7
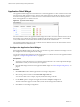
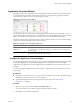
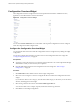
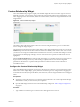
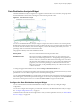
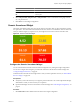
Table Of Contents
- VMware vCenter Operations Manager Getting Started Guide
- Contents
- VMware vCenter Operations Manager Getting Started Guide
- Introducing Custom User Interface Features and Concepts
- Introducing Common Tasks
- Logging In and Using vCenter Operations Manager
- Monitoring Day-to-Day Operations
- Handling Alerts
- Optimizing Your Resources
- Designing Your Workspace
- Using and Configuring Widgets
- Edit a Widget Configuration
- Supported Widget Interactions
- Configure Widget Interactions
- Advanced Health Tree Widget
- Alerts Widget
- Application Detail Widget
- Application Overview Widget
- Configuration Overview Widget
- Custom Relationship Widget
- Data Distribution Analysis Widget
- Generic Scoreboard Widget
- GEO Widget
- Health Status Widget
- Health Tree Widget
- Health-Workload Scoreboard Widget
- Heat Map Widget
- Mashup Charts Widget
- Metric Graph Widget
- Metric Graph (Rolling View) Widget
- Metric Selector Widget
- Metric Sparklines Widget
- Metric Weather Map Widget
- Resources Widget
- Root Cause Ranking Widget
- Tag Selector Widget
- Text Widget
- Top-N Analysis Widget
- VC Relationship Widget
- VC Relationship (Planning) Widget
- Define Metric Sets for a Widget
- Index

Application Detail Widget
The Application Detail widget shows information for a selected application or other container resources that
have at least one child container resource. The top of the widget shows the number of containers, resources,
and metrics that the application or container resource contains and the number of Smart Alerts and classic
alerts on the application or container resource.
Figure 4-3. Application Detail Widget
For each container resource, the Application Detail widget shows the icons for the health of each resource in
that container, the container name, the metric sparkline for the last 24 hours, the container's current health
score, and the number of active Smart Alerts and classic alerts for the container itself.
The Application Detail widget shows only container resources that have at least one child container. It does
not show information for child resources.
Configure the Application Detail Widget
If
the Application Detail widget is a self provider, you can select a tag value to monitor in the widget. You can
also configure the column arrangement in the widget.
You can also configure other widgets to provide an application or container resource to the Application Detail
widget. See “Configure Widget Interactions,” on page 57.
Prerequisites
n
Verify that you have the necessary access rights to perform this task. Your vCenter Operations Manager
administrator can tell you which actions you can perform.
n
Open the Edit Widget window for the Application Detail widget. See “Edit a Widget Configuration,” on
page 52.
Procedure
1 Set Self Provider to On to define applications in the widget configuration.
2 Select the tag value to monitor in the Select which tags to filter list.
You can use toolbar icons to collapse, expand, and deselect all tags in the list.
3 Use the Mode option to configure the Application Detail in Compact or Large mode.
The same information appears in both modes, but the column arrangement is different.
4 Click OK to save the widget configuration.
VMware vCenter Operations Manager Getting Started Guide
62 VMware, Inc.