
5.7
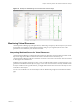
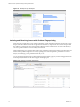
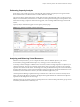

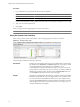
Table Of Contents
- VMware vCenter Operations Manager Getting Started Guide
- Contents
- VMware vCenter Operations Manager Getting Started Guide
- Introducing Custom User Interface Features and Concepts
- Introducing Common Tasks
- Logging In and Using vCenter Operations Manager
- Monitoring Day-to-Day Operations
- Handling Alerts
- Optimizing Your Resources
- Designing Your Workspace
- Using and Configuring Widgets
- Edit a Widget Configuration
- Supported Widget Interactions
- Configure Widget Interactions
- Advanced Health Tree Widget
- Alerts Widget
- Application Detail Widget
- Application Overview Widget
- Configuration Overview Widget
- Custom Relationship Widget
- Data Distribution Analysis Widget
- Generic Scoreboard Widget
- GEO Widget
- Health Status Widget
- Health Tree Widget
- Health-Workload Scoreboard Widget
- Heat Map Widget
- Mashup Charts Widget
- Metric Graph Widget
- Metric Graph (Rolling View) Widget
- Metric Selector Widget
- Metric Sparklines Widget
- Metric Weather Map Widget
- Resources Widget
- Root Cause Ranking Widget
- Tag Selector Widget
- Text Widget
- Top-N Analysis Widget
- VC Relationship Widget
- VC Relationship (Planning) Widget
- Define Metric Sets for a Widget
- Index

Procedure
1
In your Web browser, type the URL for the Custom user interface.
Option Description
Standalone version
https://
ip_address
vApp version
https://
ip_address
/vcops-custom
ip_address
is the IP address or fully qualified host name of the vCenter Operations Manager server or vApp.
2 Type your user name and password.
3 Click Login.
After you log in, the Home page appears in your browser window.
NOTE If your session is inactive for 30 minutes, it times out and you must log in again.
Using the Custom User Interface
After you log in to the Custom user interface, your Home page appears in the browser window.
Figure 2-1. Example Home Page
The Home page contains the following components.
Dashboards
The tabs near the top of the Home page are your dashboards. In the example,
the
dashboards are Operations and Alerts by Type. The user groups to which
you belong determine which dashboards are available to you. A
vCenter Operations Manager administrator assigns you to one or more user
groups when he or she creates your user account. You can switch to a different
dashboard by clicking its tab or selecting it from the Dashboards menu. You
can click Home at any time to return to your Home page.
Widgets
The panes on a dashboard are called widgets. A widget is a collection of related
information about attributes, resources, applications, or the overall processes
in your environment. Each dashboard contains one or more widgets. In the
example, the Operations dashboard contains the Resource Selector and Active
Alerts widgets. If your user account has the necessary access rights, you can
customize dashboards and widgets.
VMware vCenter Operations Manager Getting Started Guide
18 VMware, Inc.