
5.7
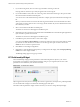
Table Of Contents
- VMware vCenter Operations Manager Getting Started Guide
- Contents
- VMware vCenter Operations Manager Getting Started Guide
- Introducing Custom User Interface Features and Concepts
- Introducing Common Tasks
- Logging In and Using vCenter Operations Manager
- Monitoring Day-to-Day Operations
- Handling Alerts
- Optimizing Your Resources
- Designing Your Workspace
- Using and Configuring Widgets
- Edit a Widget Configuration
- Supported Widget Interactions
- Configure Widget Interactions
- Advanced Health Tree Widget
- Alerts Widget
- Application Detail Widget
- Application Overview Widget
- Configuration Overview Widget
- Custom Relationship Widget
- Data Distribution Analysis Widget
- Generic Scoreboard Widget
- GEO Widget
- Health Status Widget
- Health Tree Widget
- Health-Workload Scoreboard Widget
- Heat Map Widget
- Mashup Charts Widget
- Metric Graph Widget
- Metric Graph (Rolling View) Widget
- Metric Selector Widget
- Metric Sparklines Widget
- Metric Weather Map Widget
- Resources Widget
- Root Cause Ranking Widget
- Tag Selector Widget
- Text Widget
- Top-N Analysis Widget
- VC Relationship Widget
- VC Relationship (Planning) Widget
- Define Metric Sets for a Widget
- Index

Table 4-19. VC Relationship Widget Icons
Icon Description
Show Risk Values Changes the object display to show risk scores. The risk score indicates potential future
problems that might affect the performance of your system. vCenter Operations Manager
calculates the risk score based on the time remaining and stress scores.
Show Time Remaining
Values
Changes the object display to show time remaining scores. The time remaining score indicates
how much time remains before the resources of the object are exhausted.
vCenter Operations Manager calculates the score by resource type (for example, CPU use or
disk I/O) based on historical data for the pattern of use for the resource type. You can use the
time remaining score to plan provisioning of physical or virtual resources for the object or
rebalance the workload in your virtual infrastructure.
Show Capacity Values Changes the object display to show capacity scores. The capacity score indicates how close a
virtual object is to exhausting its available computing resources. Computing resources include
disk space, memory size, and network capacity.
Show Stress Values Changes the object display to show stress scores. The stress score indicates the historic
workload of the object.
Show Efficiency Values Changes the object display to show efficiency values. The efficiency score helps you identify
optimization opportunities in your system. vCenter Operations Manager calculates the
efficiency score based on the scores of the waste and density badges.
Show Waste Values Changes the object display to show waste scores. The waste score indicates over-provisioning
in your virtual infrastructure or for a specific object. vCenter Operations Manager calculates
waste for each resource type, such as CPU, memory, and disk, for each object in the
environment. You can use the waste score to identify the amount of resources that you can
reclaim and provision to other objects in your environment.
Show Density Values Changes the object display to show density scores. The density score indicates the consolidation
ratios, such as virtual machine per host, virtual CPUs per physical CPU, virtual memory per
physical memory, and so on. You can use the density score to achieve higher consolidation
ratios and cost savings.
You can use the STATUS FILTER buttons to filter objects by state. In large inventories, filtering objects by
state can help you quickly find objects that have degraded performance characteristics.
You
can use the VC FILTER drop-down menu to filter objects by vCenter Server system. If you select a specific
vCenter Server system, the widget shows only objects for that vCenter Server system. If you select ALL, the
widget shows objects for all vCenter Server systems in your environment.
With the SORT BY drop-down menu, you can sort the object display by object name or value.
The only configuration options for the VC Relationship (Planning) widget are the widget title and widget
refresh settings.
Define Metric Sets for a Widget
You can use an XML file to define metric sets for the Metric Graph, Metric Graph (Rolling View), Metric
Sparklines, Data Distribution Analysis, and Generic Scoreboard widgets.
A metric set defines a fixed set of of metrics for the widget to draw when you select a particular resource. You
can select a metric set definition XML file when you edit the widget configuration.
You can obtain keys and identifiers to use in a metric set definition XML file by accessing the
vCenter Operations Manager database and running SQL queries. See “Retrieve Keys and Identifiers from the
Database,” on page 106.
Prerequisites
Verify that you have the necessary access rights to perform this task. Your vCenter Operations Manager
administrator can tell you which actions you can perform.
VMware vCenter Operations Manager Getting Started Guide
104 VMware, Inc.