
5.7
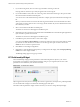
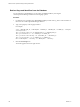
Table Of Contents
- VMware vCenter Operations Manager Getting Started Guide
- Contents
- VMware vCenter Operations Manager Getting Started Guide
- Introducing Custom User Interface Features and Concepts
- Introducing Common Tasks
- Logging In and Using vCenter Operations Manager
- Monitoring Day-to-Day Operations
- Handling Alerts
- Optimizing Your Resources
- Designing Your Workspace
- Using and Configuring Widgets
- Edit a Widget Configuration
- Supported Widget Interactions
- Configure Widget Interactions
- Advanced Health Tree Widget
- Alerts Widget
- Application Detail Widget
- Application Overview Widget
- Configuration Overview Widget
- Custom Relationship Widget
- Data Distribution Analysis Widget
- Generic Scoreboard Widget
- GEO Widget
- Health Status Widget
- Health Tree Widget
- Health-Workload Scoreboard Widget
- Heat Map Widget
- Mashup Charts Widget
- Metric Graph Widget
- Metric Graph (Rolling View) Widget
- Metric Selector Widget
- Metric Sparklines Widget
- Metric Weather Map Widget
- Resources Widget
- Root Cause Ranking Widget
- Tag Selector Widget
- Text Widget
- Top-N Analysis Widget
- VC Relationship Widget
- VC Relationship (Planning) Widget
- Define Metric Sets for a Widget
- Index

Table 4-17. Top-N Analysis Widget Toolbar Icons
Icon Description
Auto Refresh Refreshes the widget data.
Resource Detail Select a resource and click this icon to show the Resource Detail page for the resource.
Display Filtering Criteria Shows the filtering settings for the widget in a pop-up window.
Configure the Top-N Analysis Widget
You
can select the metric that the Top-N Analysis widget considers when it builds its list by editing the widget
configuration. The Top-N Analysis widget does not show data until you configure it.
You can configure other widgets to provide a metric selection to the Top-N Analysis widget. See “Configure
Widget Interactions,” on page 57.
Prerequisites
n
Verify that you have the necessary access rights to perform this task. Your vCenter Operations Manager
administrator can tell you which actions you can perform.
n
Open the Edit Widget window for the Top-N Analysis widget. See “Edit a Widget Configuration,” on
page 52.
Procedure
1 Configure the appearance of the widget display.
Option Action
Period Length
To show an average of historical metric values, select a time period such as
Last
Hour, or select Current Value to show a ranked order of resources based
only on current metric values.
NOTE If you select Current Value, the widget shows more up-to-date
information and performance improves because the widget requires only the
latest metric value for each resource rather than a number of historical values.
Bars Count
By default, the widget shows the top five items in the category you select.
You can change the count to 10 or 15, or select User Defined and type a
number in the text box.
Depth
Select a value from 1 to 10.
Application Health and Performance
Select application health and performance categories for which the widget
can
show information. Tag mode and Metric mode have different lists. This
list appears only in Tag mode.
Problem and Alert Analysis
Select problem and alert analysis categories for which the widget can show
information. Tag mode and Metric mode have different lists. This list appears
only in Tag mode.
Metric Analysis
Select metric analysis categories for which the widget can show information.
Tag mode and Metric mode have different lists. This list appears only in
Metric mode.
2
Select a Widget Mode option.
Option Description
Tag
Shows items that are related to resources.
Metric
Shows items that are related to specific metrics. Because Metric mode
requires
you to select a specific metric, it does not provide results if the Top-
N Analysis widget accepts resources from the Application Overview or Tag
Selector widget.
Chapter 4 Using and Configuring Widgets
VMware, Inc. 101