
5.6
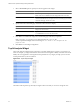
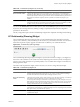
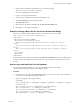

Table Of Contents
- VMware vCenter Operations Manager Getting Started Guide
- Contents
- VMware vCenter Operations Manager Getting Started Guide
- Introducing Custom User Interface Features and Concepts
- Introducing Common Tasks
- Logging In and Using vCenter Operations Manager
- Monitoring Day-to-Day Operations
- Handling Alerts
- Optimizing Your Resources
- Designing Your Workspace
- Using and Configuring Widgets
- Edit a Widget Configuration
- Supported Widget Interactions
- Configure Widget Interactions
- Advanced Health Tree Widget
- Alerts Widget
- Application Detail Widget
- Application Overview Widget
- Configuration Overview Widget
- Data Distribution Analysis Widget
- Generic Scoreboard Widget
- GEO Widget
- Health Status Widget
- Health Tree Widget
- Health-Workload Scoreboard Widget
- Heat Map Widget
- Mashup Charts Widget
- Metric Graph Widget
- Metric Graph (Rolling View) Widget
- Metric Selector Widget
- Metric Sparklines Widget
- Metric Weather Map Widget
- Resources Widget
- Root Cause Ranking Widget
- Tag Selector Widget
- Text Widget
- Top-N Analysis Widget
- VC Relationship Widget
- VC Relationship (Planning) Widget
- Define Metric Sets for a Widget
- Index

4 If you selected Metric mode, select one or more tag values in the Select which tag to show pane to filter
the resource kinds in the Resource Kinds pane.
You can use icons on the toolbar at the top of the list to collapse, expand, and deselect all of the tags in the
list.
When you select more than one value for the same tag, the list includes resource kinds that have either
value. When you select values for two or more tags, the list includes only resource kinds that have all of
the values that you select.
5 Select a resource kind in the Resource Kinds pane.
The metrics for the resource kind appear in the Metrics pane.
6 (Optional) Type all or part of the resource kind name in the Search text box and click the right angle bracket
(>) to search for a specific resource kind.
The metrics for the resource kind appear in the Metrics pane.
7 In the Metrics pane, select the metric to show in the widget.
You can click the Show Common Metrics icon at the top of the list to show only metrics that are shared
by all resources of the selected resource kind.
8 Click OK to save the widget configuration.
9 (Optional) To verify the filtering settings that you configured for the widget, click the Display Filtering
Criteria icon on the widget's toolbar.
The filtering settings appear in a pop-up window.
VC Relationship Widget
The VC Relationship widget provides performance and relationship data for objects in your virtual
environment. It uses badges to represent derived metrics and give you a high-level, broad view of the
performance and condition of your virtual environment.
Figure 4-21. VC Relationship Widget
Objects appear in hierarchy levels. If a badge does not have a green status, the object has a potential problem.
You can double-click a badge to see the Resource Detail page for that object.
The toolbar at the top left of the widget contains icons that you can use to change the object display.
Table 4-18. VC Relationship Widget Icons
Icon Description
Show Health Values Changes the object display to show health ratings. The health rating gives you a quick overview
of the current state of a resource. vCenter Operations Manager examines internally generated
metrics and uses its proprietary analytics formulas to determine the health rating. Internally
generated metrics include the total number of alerts and anomalies and the number of active
alerts.
Show Workload Values Changes the object display to show workload scores. The workload score is a combination of
the metrics that show the demand on an object. These metrics include CPU use and memory
use. If an object has a workload score that is greater than 100, you might need to allocate more
resources to the object or move some tasks to other objects.
VMware vCenter Operations Manager Getting Started Guide
96 VMware, Inc.