
5.6
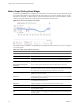
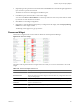
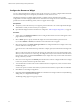
Table Of Contents
- VMware vCenter Operations Manager Getting Started Guide
- Contents
- VMware vCenter Operations Manager Getting Started Guide
- Introducing Custom User Interface Features and Concepts
- Introducing Common Tasks
- Logging In and Using vCenter Operations Manager
- Monitoring Day-to-Day Operations
- Handling Alerts
- Optimizing Your Resources
- Designing Your Workspace
- Using and Configuring Widgets
- Edit a Widget Configuration
- Supported Widget Interactions
- Configure Widget Interactions
- Advanced Health Tree Widget
- Alerts Widget
- Application Detail Widget
- Application Overview Widget
- Configuration Overview Widget
- Data Distribution Analysis Widget
- Generic Scoreboard Widget
- GEO Widget
- Health Status Widget
- Health Tree Widget
- Health-Workload Scoreboard Widget
- Heat Map Widget
- Mashup Charts Widget
- Metric Graph Widget
- Metric Graph (Rolling View) Widget
- Metric Selector Widget
- Metric Sparklines Widget
- Metric Weather Map Widget
- Resources Widget
- Root Cause Ranking Widget
- Tag Selector Widget
- Text Widget
- Top-N Analysis Widget
- VC Relationship Widget
- VC Relationship (Planning) Widget
- Define Metric Sets for a Widget
- Index

Configure the Metric Sparklines Widget
You can select the metrics that the Metric Sparklines widget shows by editing the widget configuration.
You can also configure other widgets to provide metric selections to the Metric Sparklines widget. See
“Configure Widget Interactions,” on page 56.
To define a fixed set of metrics for the widget to draw when you select a particular resource, see “Define Metric
Sets for a Widget,” on page 98.
Prerequisites
n
Verify that you have the necessary access rights to perform this task. Your vCenter Operations Manager
administrator can tell you which actions you can perform.
n
Open the Edit Widget window for the Metric Sparklines widget. See “Edit a Widget Configuration,” on
page 52.
Procedure
1 Set Self Provider to On to define metric selections in the widget configuration.
2 (Optional) Select one or more tag values in the list to the left of the List pane to filter the resources that
appear in the List pane.
You can use icons on the toolbar at the top of the list to collapse, expand, and deselect all of the tags in the
list.
When you select more than one value for the same tag, the list includes resources that have either value.
When you select values for two or more tags, the list includes only resources that have all of the values
that you select. When you click the Invert Result icon, the list includes only resources that do not match
the tag values that you select.
3 In the List pane, select one or more resources.
Option Action
Select a specific resource
Select the resource in the list. You can type all or part of the resource name
in the Search text box and click the right angle bracket (>) to search for the
resource.
Select multiple resources
a Press Ctrl+click to select multiple resources or Shift+click to select a range
of resources.
b Click the Perform Multi-Select Interaction icon on the toolbar at the top
of the List pane.
Clear all of your selections
Click the Clear Selection icon on the toolbar at the top of the List pane.
The metrics for the resources appear in the Metric Selector With Resource Selection pane.
4 In Metric Selector With Resource Selection pane, select the metrics to show in the widget.
Option Action
Select a specific resource
Double-click the metric.
Select multiple metrics
a Press Ctrl+click to select multiple metrics or Shift+click to select a range
of metrics.
b Click the Perform Multi-Select icon on the toolbar at the top of the Metric
Selector With Resource Selection pane.
List the metrics that are common to
multiple selected resources
Click the Show Common Metrics icon on the toolbar at the top of the Metric
Selector With Resource Selection pane.
The metrics that you select appear in the Selected Metrics pane.
VMware vCenter Operations Manager Getting Started Guide
86 VMware, Inc.