
5.6
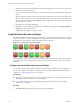
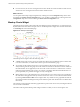
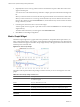
Table Of Contents
- VMware vCenter Operations Manager Getting Started Guide
- Contents
- VMware vCenter Operations Manager Getting Started Guide
- Introducing Custom User Interface Features and Concepts
- Introducing Common Tasks
- Logging In and Using vCenter Operations Manager
- Monitoring Day-to-Day Operations
- Handling Alerts
- Optimizing Your Resources
- Designing Your Workspace
- Using and Configuring Widgets
- Edit a Widget Configuration
- Supported Widget Interactions
- Configure Widget Interactions
- Advanced Health Tree Widget
- Alerts Widget
- Application Detail Widget
- Application Overview Widget
- Configuration Overview Widget
- Data Distribution Analysis Widget
- Generic Scoreboard Widget
- GEO Widget
- Health Status Widget
- Health Tree Widget
- Health-Workload Scoreboard Widget
- Heat Map Widget
- Mashup Charts Widget
- Metric Graph Widget
- Metric Graph (Rolling View) Widget
- Metric Selector Widget
- Metric Sparklines Widget
- Metric Weather Map Widget
- Resources Widget
- Root Cause Ranking Widget
- Tag Selector Widget
- Text Widget
- Top-N Analysis Widget
- VC Relationship Widget
- VC Relationship (Planning) Widget
- Define Metric Sets for a Widget
- Index
5 If you selected General mode, select the attribute to use to set the size of the rectangle for each resource
in the Size By list and the attribute to use to determine the color of the rectangle for each resource in the
Color By list.
Resources that have higher values for the Size By attribute have larger areas of the widget display. You
can also select fixed-size rectangles. The color varies between the colors you set based on the value of the
Color By attribute.
In most cases, the attribute lists include only metrics that vCenter Operations Manager generates. If you
select a resource kind, the list shows all of the attributes that are defined for the resource kind.
6 To track metrics only for resources of a particular kind, select the resource kind from the Resource
Kinds drop-down menu.
7 If you selected Instance mode, select an attribute kind from the Attribute Kinds list.
The attribute kind determines the color of the rectangle for each resource.
8 Configure colors for the heat map.
a Click each of the small blocks under the color bar to set the color for low, middle, and high values.
The bar shows the color range for intermediate values. You can also set the values to match the high
and low end of the color range.
b (Optional) Type minimum and maximum color values in the Min Value and Max Value text boxes.
If you leave the text boxes blank, vCenter Operations Manager maps the highest and lowest values
for the Color By metric to the end colors. If you set a minimum or maximum value, any metric at or
beyond that value appears in the end color.
9 To define the resources to show in the widget, select the tag values to monitor in the Select which tags to
filter list.
If you select a resource kind, the widget shows only resources of that kind that meet the tag filter
conditions.
When you select more than one value for the same tag, the widget includes resources that have either
value. When you select values for two or more tags, the widget includes only resources that have all of
the values that you select.
10 Click the Capture new configuration icon, type a name for the configuration, and click OK to save the
configuration.
You must save a Heat Map widget configuration before you can use it.
11 (Optional) Select the configuration from the Configuration drop-down menu on the widget's toolbar to
verify the Heat Map widget configuration.
Example: Heat Map Widget Configuration
Consider an environment that has these characteristics.
n
Multiple physical servers, in multiple data servers, that are running multiple virtual servers.
n
Each virtual server is defined as a resource in vCenter Operations Manager.
n
Each resource has several attributes for which vCenter Operations Manager collects data.
For this enviroment, the following Heat Map widget configuration shows at a glance which virtual machines
have anomalies, whether those anomalies are for KPIs, and on which physical servers the virtual machines
reside.
n
All resources that have a resource kind tag value of virtual machine are shown.
n
The resources are grouped by physical server and then by data center.
Chapter 4 Using and Configuring Widgets
VMware, Inc. 75