
5.6
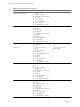
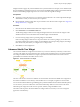
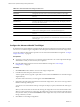
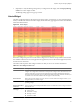
Table Of Contents
- VMware vCenter Operations Manager Getting Started Guide
- Contents
- VMware vCenter Operations Manager Getting Started Guide
- Introducing Custom User Interface Features and Concepts
- Introducing Common Tasks
- Logging In and Using vCenter Operations Manager
- Monitoring Day-to-Day Operations
- Handling Alerts
- Optimizing Your Resources
- Designing Your Workspace
- Using and Configuring Widgets
- Edit a Widget Configuration
- Supported Widget Interactions
- Configure Widget Interactions
- Advanced Health Tree Widget
- Alerts Widget
- Application Detail Widget
- Application Overview Widget
- Configuration Overview Widget
- Data Distribution Analysis Widget
- Generic Scoreboard Widget
- GEO Widget
- Health Status Widget
- Health Tree Widget
- Health-Workload Scoreboard Widget
- Heat Map Widget
- Mashup Charts Widget
- Metric Graph Widget
- Metric Graph (Rolling View) Widget
- Metric Selector Widget
- Metric Sparklines Widget
- Metric Weather Map Widget
- Resources Widget
- Root Cause Ranking Widget
- Tag Selector Widget
- Text Widget
- Top-N Analysis Widget
- VC Relationship Widget
- VC Relationship (Planning) Widget
- Define Metric Sets for a Widget
- Index

Widget interactions apply only to the dashboard where you define them. For example, on one dashboard, the
Root Cause Ranking widget might receive its resources from the Health Widget widget. On another dashboard,
the Root Cause Ranking widget might receive its resources from the Tag Selector widget.
Prerequisites
n
Verify that you have the necessary access rights to perform this task. Your vCenter Operations Manager
administrator can tell you which actions you can perform.
n
Become familiar with the widgets that can provide and receive data from other widgets. See “Supported
Widget Interactions,” on page 53.
Procedure
1 Click the tab for the dashboard that contains the widgets to interact.
2 Click Interactions on the Dashboard Tools bar.
The Receiving Widget column on the Configure Widget Interactions window lists the widgets on the
dashboard that can receive information from another widget on the dashboard.
3 For each receiving widget, select a providing widget or select None.
If the Providing Widget column has two drop-down menus for a receiving widget, you can select one
providing widget from each menu. When you select None for all of the providing widgets, that widget
does not show any data unless you configure it is as a self provider.
4 Click OK to save the configuration.
Advanced Health Tree Widget
The Advanced Health Tree widget shows the section of your resource hierarchy around any resources that
you select. The widget shows the selected resource and its parent and child resources. The Advanced Health
Tree widget is similar to the Health Tree widget, except that it includes information about the resource's
grandchildren and indicates the health of each resource.
Figure 4-1. Advanced Health Tree Widget
The color of the icon for each resource indicates its current health. The Advanced Health Tree widget shows
the number of children for each child, by current health color. For example, it might show that one child
resource has five children that have good health (green), and three children that have abnormal health (yellow).
You can click any resource to make it the center of the relationships. When a resource is the center of the
relationships, the widget shows the resource's parents, children, and grandchildren count.
The toolbar at the top of the Advanced Health Tree widget contains icons that you can use to change the
appearance of the hierarchy.
Chapter 4 Using and Configuring Widgets
VMware, Inc. 57