
5.6
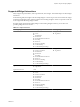
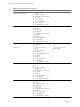
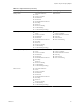
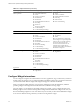
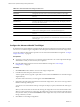
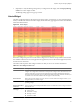
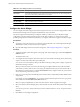
Table Of Contents
- VMware vCenter Operations Manager Getting Started Guide
- Contents
- VMware vCenter Operations Manager Getting Started Guide
- Introducing Custom User Interface Features and Concepts
- Introducing Common Tasks
- Logging In and Using vCenter Operations Manager
- Monitoring Day-to-Day Operations
- Handling Alerts
- Optimizing Your Resources
- Designing Your Workspace
- Using and Configuring Widgets
- Edit a Widget Configuration
- Supported Widget Interactions
- Configure Widget Interactions
- Advanced Health Tree Widget
- Alerts Widget
- Application Detail Widget
- Application Overview Widget
- Configuration Overview Widget
- Data Distribution Analysis Widget
- Generic Scoreboard Widget
- GEO Widget
- Health Status Widget
- Health Tree Widget
- Health-Workload Scoreboard Widget
- Heat Map Widget
- Mashup Charts Widget
- Metric Graph Widget
- Metric Graph (Rolling View) Widget
- Metric Selector Widget
- Metric Sparklines Widget
- Metric Weather Map Widget
- Resources Widget
- Root Cause Ranking Widget
- Tag Selector Widget
- Text Widget
- Top-N Analysis Widget
- VC Relationship Widget
- VC Relationship (Planning) Widget
- Define Metric Sets for a Widget
- Index

Table 4-1. Widget Interactions (Continued)
Receiving Widget Providing Widget 1 Providing Widget 2
Metric Sparklines
n
Advanced Health Tree
n
Alerts
n
Generic Scoreboard
n
Health Status
n
Health Tree
n
Health-Workload Scoreboard
n
Heat Map
n
Resources
n
Root Cause Ranking
n
VC Relationship
n
VC Relationship (Planning)
n
Alerts
n
Generic Scoreboard
n
Health-Workload Scoreboard
n
Heat Map
n
Metric Selector
n
Root Cause Ranking
Metric Weather Map None
Resources
n
Advanced Health Tree
n
Alerts
n
Generic Scoreboard
n
Health Status
n
Health Tree
n
Health-Workload Scoreboard
n
Heat Map
n
Root Cause Ranking
n
VC Relationship
n
VC Relationship (Planning)
n
Application Overview
n
Tag Selector
n
Alerts
NOTE For the Resources widget, the
Alerts widget is in a separate provider
category. If it is a provider, selecting
one or more alerts displays the
resources for those alerts. You can
select the Alerts widget and any
providing widget that is selected from
the other two categories.
Root Cause Ranking
n
Advanced Health Tree
n
Alerts
n
Generic Scoreboard
n
Health Status
n
Health Tree
n
Health-Workload Scoreboard
n
Heat Map
n
Resources
n
VC Relationship
n
VC Relationship (Planning)
n
Application Overview
n
Tag Selector
Tag Selector None
Top-N-Analysis
n
Application Overview
n
Tag Selector
Configure Widget Interactions
You can configure a widget to show information for resources, applications, tags, or metrics that you select in
another widget. For example, you can configure the Metric Sparklines widget to show a graph for a metric that
you select in the Metric Selector widget. Both widgets must appear on the same dashboard.
When you configure widget interaction, you specify the widget that provides the information, called the
providing widget, to the widget that shows the information, called the receiving widget.
For some widgets, you can define two providing widgets. For example, you can configure the Root Cause
Ranking widget to receive data from the Tag Selector widget and the Health Status widget. In this case, the
Root Cause Ranking widget shows root cause data for any resource that you select in the Health Status widget
or for resources that have the tag value that you select in the Tag Selector widget.
VMware vCenter Operations Manager Getting Started Guide
56 VMware, Inc.