
5.0
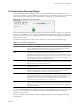

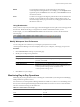
Table Of Contents
- VMware vCenter Operations Manager Enterprise Getting Started Guide
- Contents
- VMware vCenter Operations Manager Enterprise Getting Started Guide
- Introducing vCenter Operations Manager Features and Concepts
- Designing Your Workspace
- Using and Configuring Widgets
- Edit a Widget Configuration
- Configure Widget Interactions
- Advanced Health Tree Widget
- Alerts Widget
- Application Detail Widget
- Application Overview Widget
- Configuration Overview Widget
- Data Distribution Analysis Widget
- Generic Scoreboard Widget
- GEO Widget
- Health Status Widget
- Health Tree Widget
- Health-Workload Scoreboard Widget
- Heat Map Widget
- Mashup Charts Widget
- Metric Graph Widget
- Metric Graph (Rolling View) Widget
- Metric Selector Widget
- Metric Sparklines Widget
- Metric Weather Map Widget
- Resources Widget
- Root Cause Ranking Widget
- Tag Selector Widget
- Top-N Analysis Widget
- VC Relationship Widget
- VC Relationship (Planning) Widget
- Introducing Common Tasks
- Logging in and Using vCenter Operations Manager
- Monitoring Day-to-Day Operations
- Handling Alerts
- Optimizing Your Resources
- Index

Health Status Pane
Located in the upper left of the Resource Detail page, this pane shows the current health score of the resource.
A health score is a 0 to 100 ranking that vCenter Operations Manager determines for each resource. The Health
Status pane shows the current health score of a global resource and a graph that shows how the health score
has changed over the last six hours.
NOTE If vCenter Operations Manager does not receive metrics for a resource at a particular time, it cannot
calculate the health score for that time and it shows a score of -1 on the graph. A -1 score can occur if collection
is turned off for a resource or if vCenter Operations Manager encounters a data gathering problem.
Root Cause Ranking Pane
This pane shows information about metrics on related resources that contributed to alerts, including the
percentage likelihood that the metrics contributed to a root cause. vCenter Operations Manager bases the
percentage likelihood that a metric contributed to a root cause on the number of symptoms and when the
symptoms occurred relative to the alert.
For more information about the information in the Root Cause Ranking pane, see “Understanding Health
Symptoms,” on page 79.
Health Tree Pane
This pane shows the section of the resource hierarchy around a global resource, including all of the parent
container resources that hold the resource. If the resource is a container, the health tree also shows all of the
child resources that the container resource holds.
Metric Selector and Metric Graph Panes
When you click a resource in the Health Tree pane, the metric groups for the resource appear in the Metric
Selector pane. You can expand a metric group to view the individual metrics in the group. You can double-
click a metric in the Metric Selector pane to view a graph for the metric in the Metric Graph pane. Metric graphs
show the recent performance and predicted future performance of metrics for a resource.
Resource Detail Information for Virtual Resources
For virtual resources, the Resource Detail page shows information about performance characteristics, key
metrics, and events. The information on the Resource Detail page is organized in several panes.
For resource pools and folders, the Resource Detail page shows the same information that it does for global
resources.
Status Pane
Located in the upper left of the Resource Detail page, this pane contains aggregated information about the
health, workload, anomalies, and faults of the selected resource. The default history graph period is six hours.
You can click metric icons to switch the metric to view.
Workload Pane
This pane shows information about space use and read and write capacity. The Space bar represents the amount
of space used. The IOPs (input/output operations per second), Throughput, and Latency bars provide read
and write capacity information.
Object Resources Pane
This pane contains details about the virtual hardware resources that are allocated to the selected object.
Chapter 4 Introducing Common Tasks
VMware, Inc. 77