
5.0

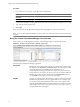
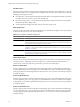
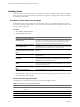
Table Of Contents
- VMware vCenter Operations Manager Enterprise Getting Started Guide
- Contents
- VMware vCenter Operations Manager Enterprise Getting Started Guide
- Introducing vCenter Operations Manager Features and Concepts
- Designing Your Workspace
- Using and Configuring Widgets
- Edit a Widget Configuration
- Configure Widget Interactions
- Advanced Health Tree Widget
- Alerts Widget
- Application Detail Widget
- Application Overview Widget
- Configuration Overview Widget
- Data Distribution Analysis Widget
- Generic Scoreboard Widget
- GEO Widget
- Health Status Widget
- Health Tree Widget
- Health-Workload Scoreboard Widget
- Heat Map Widget
- Mashup Charts Widget
- Metric Graph Widget
- Metric Graph (Rolling View) Widget
- Metric Selector Widget
- Metric Sparklines Widget
- Metric Weather Map Widget
- Resources Widget
- Root Cause Ranking Widget
- Tag Selector Widget
- Top-N Analysis Widget
- VC Relationship Widget
- VC Relationship (Planning) Widget
- Introducing Common Tasks
- Logging in and Using vCenter Operations Manager
- Monitoring Day-to-Day Operations
- Handling Alerts
- Optimizing Your Resources
- Index

Menus
You use the menus at the top of your Home page to select and use
vCenter Operations Manager features. For example, you use the Reports menu
to generate reports, the Alerts menu to view alerts, and the Forensics menu to
use forensics features.
Icons
You click icons on pages and widgets to perform tasks in the user interface. For
example, you can click the icons in a widget to expand, collapse, resize, or
remove the widget. When you point to an icon, a tooltip appears that describes
the function of the icon.
Using Breadcrumbs
When you move away from your Home page, a breadcrumb appears in the top left corner of the page under
the menu bar. Breadcrumbs help you navigate the user interface and determine where you are.
In the example, you can click Environment Overview in the breadcrumb to return to the Environment
Overview page.
Modify Workspace User Preferences
You can change the color scheme for your workspace, specify the time zone that
vCenter Operations Manager uses when it displays times in your workspace, and change your password.
Procedure
1 Click User Preferences at the top of your Home page.
2 Modify your workspace user preferences.
Option Action
Change your password
Click change next to Password, type your current password and new
password, and click OK.
Change the color scheme
Select a color scheme from the Scheme drop-down menu.
Change the time zone
Select an option from the Time Preference drop-down menu. Select
Browser to use the time settings on your computer or Host to sync your
vCenter Operations Manager session with the time on the
vCenter Operations Manager server.
3 Click OK to save your changes.
Monitoring Day-to-Day Operations
Monitoring day-to-day operations involves evaluating the overall health of your enterprise and identifying
health problems for specific resources.
For each resource, vCenter Operations Manager determines a health score, which is a 0 to 100 ranking. One of
the ways that vCenter Operations Manager indicates the health of a resource is to show a colored indicator.
The color is based on the range of the health score.
Table 4-1. Default Health Color Ranges
Color Range
Green 76 to 100
Yellow 51 to 75
Chapter 4 Introducing Common Tasks
VMware, Inc. 75