
5.0
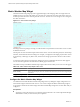
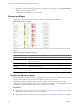
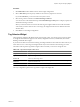
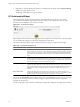
Table Of Contents
- VMware vCenter Operations Manager Enterprise Getting Started Guide
- Contents
- VMware vCenter Operations Manager Enterprise Getting Started Guide
- Introducing vCenter Operations Manager Features and Concepts
- Designing Your Workspace
- Using and Configuring Widgets
- Edit a Widget Configuration
- Configure Widget Interactions
- Advanced Health Tree Widget
- Alerts Widget
- Application Detail Widget
- Application Overview Widget
- Configuration Overview Widget
- Data Distribution Analysis Widget
- Generic Scoreboard Widget
- GEO Widget
- Health Status Widget
- Health Tree Widget
- Health-Workload Scoreboard Widget
- Heat Map Widget
- Mashup Charts Widget
- Metric Graph Widget
- Metric Graph (Rolling View) Widget
- Metric Selector Widget
- Metric Sparklines Widget
- Metric Weather Map Widget
- Resources Widget
- Root Cause Ranking Widget
- Tag Selector Widget
- Top-N Analysis Widget
- VC Relationship Widget
- VC Relationship (Planning) Widget
- Introducing Common Tasks
- Logging in and Using vCenter Operations Manager
- Monitoring Day-to-Day Operations
- Handling Alerts
- Optimizing Your Resources
- Index

You can view root causes in Symptom mode and Resource mode.
Symptom mode
Shows the likely root cause container resources ranked by the analytical
algorithm on the container resource. You can double-click a resource to see the
symptom groups ranked by percentage of possible resources that exhibit
symptoms in the group. You can double-click a group to see the top five
individual symptoms ranked by percentage of possible resources that exhibit
the symptom. You can double-click a symptom, or select it and click Show Bar
Details, to open a pop-up window that shows detailed information about the
symptom. This is the default mode.
Resource mode
Lists the individual root cause resources ranked by number of anomalies.
Double-click a resource, or select it and click Show Bar Details, to list the
individual anomalies.
A change event symptom might include different types of events that have different messages. If all of the
change events for a symptom are the same type, the message appears to the right of the symptom bar. If the
message does not fit, you can point to the message to the see the full message. If the symptom includes different
messages, Multiple Change Events appears.
NOTE If the Health Status widget provides resources to the Root Cause Ranking widget and you click at a
point in the past on the health score graph for a resource, the Root Cause Ranking widget shows root causes
for the time that you selected.
The toolbar at the top of the Root Cause Ranking widget contains icons that you can use to view the graph.
Table 3-15. Root Cause Ranking Widget Toolbar Icons
Icon Description
Auto Refresh Refreshes the widget data.
Show Bar Details Opens a new window that shows detailed information about the threshold violations
that contributed to the selected root cause.
Perform Interaction Shows the first five alarming metrics for the resource of the selected symptom in either
the Metric Graph or Metric Sparklines widget. You must include either the Metric Graph
widget or the Metric Sparklines widgets on the dashboard and set it to receive data from
the Root Cause widget to use this feature.
Change mode Switches between Resource mode and Symptom mode.
You can double-click a root cause symptom to open a pop-up window that lists the individual threshold
violations that comprise the symptom. You can then click the Copy to Clipboard button to copy the list to the
clipboard. You might want to use this feature if you are opening a problem ticket or sending an email message
about the alert. To see the Dynamic Dashboard for a root cause resource, select it in the pop-up window and
click the Dynamic Dashboard button.
Configure the Root Cause Ranking Widget
You can configure the Root Cause Ranking widget to show specific resources.
You can also configure other widgets to provide resources to the Root Cause Ranking widget. See “Configure
Widget Interactions,” on page 26.
Prerequisites
n
Verify that you have the necessary access rights to perform this task. Your vCenter Operations Manager
administrator can tell you which actions you can perform.
n
Open the Edit Widget window for the Root Cause Ranking widget. See “Edit a Widget Configuration,”
on page 26.
VMware vCenter Operations Manager Enterprise Getting Started Guide
66 VMware, Inc.