
5.0
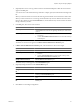
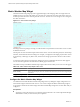
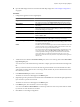
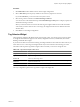
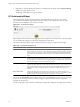
Table Of Contents
- VMware vCenter Operations Manager Enterprise Getting Started Guide
- Contents
- VMware vCenter Operations Manager Enterprise Getting Started Guide
- Introducing vCenter Operations Manager Features and Concepts
- Designing Your Workspace
- Using and Configuring Widgets
- Edit a Widget Configuration
- Configure Widget Interactions
- Advanced Health Tree Widget
- Alerts Widget
- Application Detail Widget
- Application Overview Widget
- Configuration Overview Widget
- Data Distribution Analysis Widget
- Generic Scoreboard Widget
- GEO Widget
- Health Status Widget
- Health Tree Widget
- Health-Workload Scoreboard Widget
- Heat Map Widget
- Mashup Charts Widget
- Metric Graph Widget
- Metric Graph (Rolling View) Widget
- Metric Selector Widget
- Metric Sparklines Widget
- Metric Weather Map Widget
- Resources Widget
- Root Cause Ranking Widget
- Tag Selector Widget
- Top-N Analysis Widget
- VC Relationship Widget
- VC Relationship (Planning) Widget
- Introducing Common Tasks
- Logging in and Using vCenter Operations Manager
- Monitoring Day-to-Day Operations
- Handling Alerts
- Optimizing Your Resources
- Index

Procedure
1 Type a value in the Pagination number text box to configure the number of resources that appear on each
page in the Resources widget.
2 Select a Mode option to specify whether the widget shows the selected child or parent resources.
If you select Children or Parents, the selected resources themselves do not appear.
3 Select the tag values in the Select which tags to filter list to configure the Resources widget to show only
resources that have certain tag values.
You can use icons on the toolbar at the top of the list to collapse, expand, and deselect all of the tags in the
list.
When you select more than one value for the same tag, the widget shows resources that have either value.
When you select values for two or more tags, the widget shows only resources that have all of the values
that you select. When you click the Invert Result icon, the widget shows only resources that do not match
the tag values that you select.
4 Click one or more categories in the Filter By list and select status values to configure the Resources widget
to show only resources that have specific status values.
5 To set the default sort order for the resources that the Resources widget shows, select sort criteria in the
Sort Data By pane.
You can sort up to four column values and by any of the standard columns, except for Resource Identifier.
6 Click OK to save the widget configuration.
7 (Optional) Click the Display Filtering Criteria icon on the Resources widget's toolbar to verify the filtering
settings that you configured for the widget.
The filtering settings appear in a pop-up window.
Root Cause Ranking Widget
The Root Cause Ranking widget provides an instant view of the probable causes of health degradation for a
selected resource. The widget shows information about metrics on related resources that contributed to alerts
on the resources, including the percentage likelihood that the metric contributed to the cause.
vCenter Operations Manager bases the percentage likelihood on the number of symptoms and when the
symptoms occurred relative to the alert.
Figure 3-19. Root Cause Ranking Widget
Chapter 3 Using and Configuring Widgets
VMware, Inc. 65