
5.0
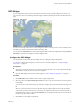
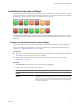
Table Of Contents
- VMware vCenter Operations Manager Enterprise Getting Started Guide
- Contents
- VMware vCenter Operations Manager Enterprise Getting Started Guide
- Introducing vCenter Operations Manager Features and Concepts
- Designing Your Workspace
- Using and Configuring Widgets
- Edit a Widget Configuration
- Configure Widget Interactions
- Advanced Health Tree Widget
- Alerts Widget
- Application Detail Widget
- Application Overview Widget
- Configuration Overview Widget
- Data Distribution Analysis Widget
- Generic Scoreboard Widget
- GEO Widget
- Health Status Widget
- Health Tree Widget
- Health-Workload Scoreboard Widget
- Heat Map Widget
- Mashup Charts Widget
- Metric Graph Widget
- Metric Graph (Rolling View) Widget
- Metric Selector Widget
- Metric Sparklines Widget
- Metric Weather Map Widget
- Resources Widget
- Root Cause Ranking Widget
- Tag Selector Widget
- Top-N Analysis Widget
- VC Relationship Widget
- VC Relationship (Planning) Widget
- Introducing Common Tasks
- Logging in and Using vCenter Operations Manager
- Monitoring Day-to-Day Operations
- Handling Alerts
- Optimizing Your Resources
- Index

3 Select one or more tag values in the list to the left of the List pane to filter the resources that appear in the
List pane.
You can use icons on the toolbar at the top of the list to collapse, expand, and deselect all of the tags in the
list.
When you select more than one value for the same tag, the list includes resources that have either value.
When you select values for two or more tags, the list includes only resources that have all of the values
that you select. When you click the Invert Result icon, the list includes only resources that do not match
the tag values that you select.
4 In the List pane, select the resources to show in the widget.
Option Action
Select a specific resource
Type a full or partial name in the Search text box, click the right angle bracket
(>), and double-click the resource in the search results.
Select multiple resources
Press Ctrl-click to select multiple resources or Shift-click to select a range of
resources and click the Perform Multi-Select Interaction icon on the toolbar
at the top of the List pane.
Clear all of your selections
Click the Clear Selections icon on the toolbar at the top of the List pane.
The resources that you select appear in the Selected Resources pane.
5 (Optional) Select the resource and click the Delete Resource icon to delete a selected resource.
6 Click OK to save the widget configuration.
Heat Map Widget
The Heat Map widget contains graphical indicators that show the current value of two selected attributes for
resources that belong to tag values that you select. In most cases, you can select only from internally generated
attributes that describe the general operation of the resources, such as health or the active anomaly count. When
you select a single resource kind, you can select any metric for that resource kind.
The Health Map widget has a General mode and an Instance mode.
General mode
The widget shows a colored rectangle for each selected resource. The size of
the rectangle indicates the value of one selected attribute. The color of the
rectangle indicates the value of another selected attribute.
Instance mode
Each rectangle represents a single instance of the selected metric for a resource.
A resource can have multiple instances of the same metric. The rectangles are
all the same size. The color of the rectangles varies based on the instance value.
You can use instance mode only if you select a single resource kind.
In either mode, you can group the rectangles according to tag type and select the color range to use. By default,
green indicates a low value and red indicates the high end of the value range. You can change the high and
low values to any color and set the color to use for the midpoint of the range. You can also set the values to
use for either end of the color range, or let vCenter Operations Manager define the colors based on the range
of values for the attribute.
When you point to the rectangle for a resource, the widget shows the resource's name, group-by values, and
the current values of the two tracked attributes. You can click Show Sparkline in the pop-up window to see
a small sparkline of the tracked metric by the heat map color. You can click the Resource Detail icon to show
the Resource Detail page for a selected resource.
If you configure the Heat Map widget as a provider to another widget, such as the Metric Graph widget, you
can double-click a rectangle to select that resource for the widget. If the widget is in Metric mode, double-
clicking a rectangle selects the resource associated with the metric and provides that resource to the receiving
widget.
VMware vCenter Operations Manager Enterprise Getting Started Guide
48 VMware, Inc.