
5.0
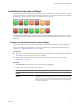
Table Of Contents
- VMware vCenter Operations Manager Enterprise Getting Started Guide
- Contents
- VMware vCenter Operations Manager Enterprise Getting Started Guide
- Introducing vCenter Operations Manager Features and Concepts
- Designing Your Workspace
- Using and Configuring Widgets
- Edit a Widget Configuration
- Configure Widget Interactions
- Advanced Health Tree Widget
- Alerts Widget
- Application Detail Widget
- Application Overview Widget
- Configuration Overview Widget
- Data Distribution Analysis Widget
- Generic Scoreboard Widget
- GEO Widget
- Health Status Widget
- Health Tree Widget
- Health-Workload Scoreboard Widget
- Heat Map Widget
- Mashup Charts Widget
- Metric Graph Widget
- Metric Graph (Rolling View) Widget
- Metric Selector Widget
- Metric Sparklines Widget
- Metric Weather Map Widget
- Resources Widget
- Root Cause Ranking Widget
- Tag Selector Widget
- Top-N Analysis Widget
- VC Relationship Widget
- VC Relationship (Planning) Widget
- Introducing Common Tasks
- Logging in and Using vCenter Operations Manager
- Monitoring Day-to-Day Operations
- Handling Alerts
- Optimizing Your Resources
- Index

4 In Metric Selector With Resource Selection pane, select the metrics to show in the widget.
NOTE The Generic Scoreboard widget does not work with string metrics.
Option Action
Select a specific resource
Double-click the metric.
Select multiple metrics
a Press Ctrl-click to select multiple metrics or Shift-click to select a range
of metrics.
b Click the Perform Multi-Select icon on the toolbar at the top of the
Metric Selector With Resource Selection pane.
List the metrics that are common to
multiple selected resources
Click the Show Common Metrics icon on the toolbar at the top of the Metric
Selector With Resource Selection pane.
The metrics that you select appear in the Selected Metrics pane.
5 (Optional) Manage the metrics in the Selected Metrics pane.
Option Action
Change the order of a metric in the
list
Select the metric and drag and drop it to another position in the list.
Remove a metric from the list
Select the metric and click the Remove Selected Metrics icon on the toolbar
at the top of the Selected Metrics pane.
Select all of the metrics in the list
Click the Select All icon on the toolbar at the top of the Selected Metrics
pane.
Remove all of the metrics from the
list
Click the Clear Selections icon on the toolbar at the top of the Selected
Metrics pane.
6 Set values for each metric in the Selected Metrics pane.
Option Description
Box Label
The text label to include in the box for this metric.
Measurement Unit
The text that appears after the metric value in the box.
Value Ranges
The value ranges for each box color for this metric. You must define either
an ascending or descending set of ranges from green through red.
n
For an ascending range, type the highest value that should be green in
Green Range.
n
In Yellow Range, type the Green Range value, a hyphen, and the highest
Yellow Range color.
n
In Orange Range, type the highest Yellow Range value, a hyphen, and
the highest Orange Range value.
n
In Red Range, repeat the highest Orange Range value. All values higher
than this are red.
7 Click OK to save the widget configuration.
VMware vCenter Operations Manager Enterprise Getting Started Guide
42 VMware, Inc.