
5.0
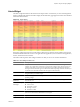
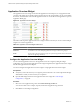
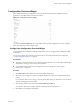
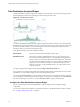
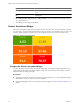
Table Of Contents
- VMware vCenter Operations Manager Enterprise Getting Started Guide
- Contents
- VMware vCenter Operations Manager Enterprise Getting Started Guide
- Introducing vCenter Operations Manager Features and Concepts
- Designing Your Workspace
- Using and Configuring Widgets
- Edit a Widget Configuration
- Configure Widget Interactions
- Advanced Health Tree Widget
- Alerts Widget
- Application Detail Widget
- Application Overview Widget
- Configuration Overview Widget
- Data Distribution Analysis Widget
- Generic Scoreboard Widget
- GEO Widget
- Health Status Widget
- Health Tree Widget
- Health-Workload Scoreboard Widget
- Heat Map Widget
- Mashup Charts Widget
- Metric Graph Widget
- Metric Graph (Rolling View) Widget
- Metric Selector Widget
- Metric Sparklines Widget
- Metric Weather Map Widget
- Resources Widget
- Root Cause Ranking Widget
- Tag Selector Widget
- Top-N Analysis Widget
- VC Relationship Widget
- VC Relationship (Planning) Widget
- Introducing Common Tasks
- Logging in and Using vCenter Operations Manager
- Monitoring Day-to-Day Operations
- Handling Alerts
- Optimizing Your Resources
- Index

Option Action
Select all of the metrics in the list
Click the Select All icon on the toolbar at the top of the Selected Metrics
pane.
Remove all of the metrics from the
list
Click the Clear Selections icon on the toolbar at the top of the Selected
Metrics pane.
6 Select 75th percentile, 90th percentile, or 95th percentile to show a vertical line on the graph at the 75,
90, or 95 percent level.
7 Click OK to save the widget configuration.
Generic Scoreboard Widget
The Generic Scoreboard widget shows the current value for each metric that you select. Each metric appears
in a separate box. The value of the metric determines the color of the box. You define the values for each color
when you edit the widget. If you point to a box, the widget shows the source resource and metric data.
Figure 3-7. Generic Scoreboard Widget
Configure the Generic Scoreboard Widget
You select the metrics that the Generic Scoreboard widget shows by editing the widget configuration. You
cannot configure the Generic Scoreboard widget to accept metric selections from other widgets. You must
define the metrics by editing the widget.
Prerequisites
n
Verify that you have the necessary access rights to perform this task. Your vCenter Operations Manager
administrator can tell you which actions you can perform.
n
Open the Edit Widget window for the Generic Scoreboard widget. See “Edit a Widget Configuration,” on
page 26.
VMware vCenter Operations Manager Enterprise Getting Started Guide
40 VMware, Inc.