
5.0
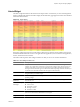
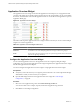
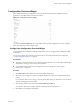
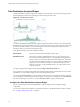
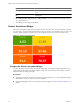
Table Of Contents
- VMware vCenter Operations Manager Enterprise Getting Started Guide
- Contents
- VMware vCenter Operations Manager Enterprise Getting Started Guide
- Introducing vCenter Operations Manager Features and Concepts
- Designing Your Workspace
- Using and Configuring Widgets
- Edit a Widget Configuration
- Configure Widget Interactions
- Advanced Health Tree Widget
- Alerts Widget
- Application Detail Widget
- Application Overview Widget
- Configuration Overview Widget
- Data Distribution Analysis Widget
- Generic Scoreboard Widget
- GEO Widget
- Health Status Widget
- Health Tree Widget
- Health-Workload Scoreboard Widget
- Heat Map Widget
- Mashup Charts Widget
- Metric Graph Widget
- Metric Graph (Rolling View) Widget
- Metric Selector Widget
- Metric Sparklines Widget
- Metric Weather Map Widget
- Resources Widget
- Root Cause Ranking Widget
- Tag Selector Widget
- Top-N Analysis Widget
- VC Relationship Widget
- VC Relationship (Planning) Widget
- Introducing Common Tasks
- Logging in and Using vCenter Operations Manager
- Monitoring Day-to-Day Operations
- Handling Alerts
- Optimizing Your Resources
- Index

Table 3-1. Widget Interactions (Continued)
Receiving Widget Providing Widget 1 Providing Widget 2
Root Cause Ranking
n
Advanced Health Tree
n
Alerts
n
Generic Scoreboard
n
Health Status
n
Health Tree
n
Health-Workload Scoreboard
n
Heat Map
n
Resources
n
VC Relationship
n
VC Relationship (Planning)
n
Application Overview
n
Tag Selector
Tag Selector None
Top-N-Analysis
n
Application Overview
n
Tag Selector
Advanced Health Tree Widget
The Advanced Health Tree widget shows the section of your resource hierarchy around any resources that
you select. The widget shows the selected resource and its parent and child resources. The Advanced Health
Tree widget is similar to the Health Tree widget, except that it includes information about the resource's
grandchildren and indicates the health of each resource.
Figure 3-1. Advanced Health Tree Widget
The color of the icon for each resource indicates its current health. The Advanced Health Tree widget shows
the number of children for each child, by current health color. For example, it might show that one child
resource has five children that have good health (green), and three children that have abnormal health (yellow).
You can click any resource to make it the center of the relationships. When a resource is the center of the
relationships, the widget shows the resource's parents, children, and grandchildren count.
The toolbar at the top of the Advanced Health Tree widget contains icons that you can use to change the
appearance of the hierarchy.
Table 3-2. Advanced Health Tree Widget Toolbar Icons
Icon Description
Zoom to Fit Changes the size of the resource icons for the best possible fit in the widget.
Pan Click this icon and click and drag the hierarchy to show different parts of the
hierarchy.
Image Map Tooltip Click this icon and point to a resource to show its name and current health.
Zoom the view Click this icon and drag to outline a part of the hierarchy. The display zooms to
show only the outlined section.
Chapter 3 Using and Configuring Widgets
VMware, Inc. 31