
1.0
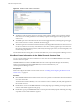
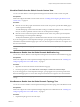
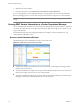
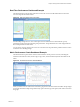
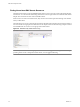

Table Of Contents
- EMC Smarts Integration Guide
- Contents
- EMC Smarts Integration Guide
- Updated Information
- Introduction to EMC Smarts Integration
- Installing the EMC Smarts Adapter
- Configuring EMC Smarts Integration
- Viewing Alerts and EMC Smarts Information
- Troubleshooting the EMC Smarts Adapter
- Index

2 Right-click the object in the list.
3 From the pop-up menu, select Client Tools > View Object in vCenter Operations.
If you are not logged in to vCenter Operations Manager, a prompt appears and you must log in before the
Resource Detail page opens. Use a user name and password that has access rights to view resource details.
NOTE vCenter Operations Manager opens in a new browser window or tab, depending on your browser
settings.
Viewing EMC Smarts Information in vCenter Operations Manager
You can view EMC Smarts information in vCenter Operations Manager dashboards and widgets. A dashboard
can contain any combination of vCenter Operations Manager widgets. Each widget shows a specific view of
a type of collected data.
For information about using and configuring dashboards and widgets, see the documentation for your
vCenter Operations Manager version.
Resource Health Dashboard Example
This dashboard shows the overall health of a section of the resource tree.
Figure 4-3. Dashboard that Shows Resource Health
n
The Resources widget lists the EMC Smarts resources defined in vCenter Operations Manager and the
health score for each resource.
n
The Advanced Health Tree widget shows the parent and child relationships for the resources selected in
the Resources widget. The resources are color-coded by health.
n
The Root Cause Ranking widget shows the metrics that vCenter Operations Manager has determined are
the biggest contributors to the health problem of the selected resources.
EMC Smarts Integration Guide
34 VMware, Inc.