
1.0
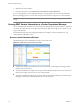
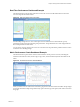
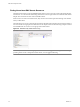
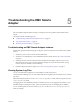

Table Of Contents
- EMC Smarts Integration Guide
- Contents
- EMC Smarts Integration Guide
- Updated Information
- Introduction to EMC Smarts Integration
- Installing the EMC Smarts Adapter
- Configuring EMC Smarts Integration
- Viewing Alerts and EMC Smarts Information
- Troubleshooting the EMC Smarts Adapter
- Index

Figure 4-2. Global Console Custom View Panel
n
The blue bar at the top of the page shows the type of alert, when it started, how long it lasted, and the
name of the resource that generated it. The internally assigned alert ID appears in the top right of the
custom view.
n
The middle pane shows information about the event that triggered the alert, including the type of trigger,
the associated resource or metric, and details about the trigger.
n
The bottom pane shows information related to the alert, including health information for the last six hours
for the associated resource and any subcontainers. It also shows a metric graph for up to five metrics for
the resource. Breaching KPIs appear first, followed by breaching super metrics, non-breaching KPIs, and
non-breaching super metrics.
For information about resolving alerts, see the documentation for your vCenter Operations Manager version.
View Root Cause Information in the Global Console Custom View
You can view information about the calculated root causes of an alert on the Root Cause tab in the Global
Console custom view panel.
The Root Cause tab is similar to the Root Cause tab in the vCenter Operations Manager Alert Summary
window. For information about the Root Cause tab, see the documentation for your
vCenter Operations Manager version.
Prerequisites
Install and configure the Global Console custom view. See “Installing and Configuring the Global Console
Custom View,” on page 20.
Procedure
n
Click the Root Cause tab in the Global Console custom view panel to see information about the calculated
root causes of the alert.
The information includes the likely root cause container resources ranked by the analytical algorithm on
the container resource.
n
Double-click a resource on the Root Cause tab to see the symptom groups ranked by percentage of possible
resources that exhibit symptoms in the group.
n
Double-click a group on the Root Cause tab to see the top five individual symptoms ranked by percentage
of possible resources that exhibit the symptom.
EMC Smarts Integration Guide
32 VMware, Inc.