
1.0
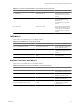
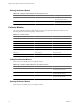
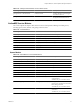
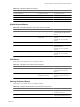
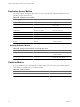
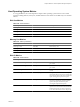


Table Of Contents
- VMware vCenter Adapter Installation and Configuration Guide
- Contents
- VMware vCenter Adapter Installation and Configuration Guide
- Updated Information
- Introduction to the vCenter Adapter
- Installing the vCenter Adapter
- Configuring the vCenter Adapter
- Troubleshooting the vCenter Adapter
- Metrics for vCenter Server Components
- Metrics for vCenter Operations Manager Components
- Index

Host Operating System Metrics
In a vApp installation, the vCenter Operations adapter collects operating system metrics for each virtual
machine,
including disk use, memory use, and disk IO metrics. These metrics are available only in 5.7 and later
releases.
Disk Use Metrics
Table 6-26. Disk Use Metrics
Metric Key Metric Name Description
diskUsage | size Disk Size (KB) Disk size.
diskUsage | used Used Disk Size (KB) Used disk size.
diskUsage | available Available Disk Size (KB) Available disk size.
diskUsage | usePercent Usage (%) Percent used disk size.
Memory Use Metrics
Table 6-27. Memory Use Metrics
Metric Key Metric Name Description
memUsage | total Total (KB) Total memory size.
memUsage | used Used (KB) Used memory size.
memUsage | free Free (KB) Free memory size.
Disk IO Metrics
Table 6-28. Disk IO Metrics
Metric Key Metric Name Description
diskIO | numberReadAvg Reads per second Number of read requests issued to the device
per second.
diskIO | numberWriteAvg Writes per second Number of write requests issued to the device
per second.
diskIO | readAvg Read Rate (KBps) Number of kilobytes read from the device per
second.
diskIO | writeAvg Write Rate (KBps) Average time, in milliseconds, for IO requests
issued to the device to be served. Includes the
time requests spend in the queue and the time
spent servicing the requests in the queue.
diskIO | await IO Request Latency (ms) Average time, in milliseconds, for IO requests
to be served. Includes the time that requests
spend in the queue and the time spent
servicing the requests in the queue.
diskIO | utilPercent CPU Time Util (%) Percentage of CPU time during which IO
requests were issued to the device (bandwidth
utilization for the device). Device saturation
occurs when this value is close to 100 percent.
Chapter 6 Metrics for vCenter Operations Manager Components
VMware, Inc. 75