
1.0
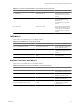
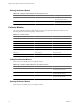
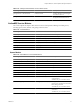


Table Of Contents
- VMware vCenter Adapter Installation and Configuration Guide
- Contents
- VMware vCenter Adapter Installation and Configuration Guide
- Updated Information
- Introduction to the vCenter Adapter
- Installing the vCenter Adapter
- Configuring the vCenter Adapter
- Troubleshooting the vCenter Adapter
- Metrics for vCenter Server Components
- Metrics for vCenter Operations Manager Components
- Index

Replication Server Metrics
The vCenter Operations adapter collects metrics for the vCenter Operations Manager Replication server,
including garbage collector metrics.
Table 6-23. Replication Server Metrics
Metric Key Metric Name Description
storageThreadCount Storage thread count Storage thread count.
ProcessedObservations Total Processed Observations Total number of processed
observations.
CurrentHeapsize Current heap size (MB) Current heap size.
MaxHeapSize Max heap size (MB) Maximum heap size.
CommittedMemory Committed memory (MB) Committed memory.
FreePhysicalMemory Free physical memory (MB) Free physical memory.
UsedMemory Used physical memory (MB) Used physical memory.
CPUUsage CPU usage (%) Percent CPU use.
Threads Threads Number of threads.
Garbage Collector Metrics
Table 6-24. Garbage Collector Metrics for the Replication Server
Metric Key Metric Name Description
garbageCollector | collectionCount Collection Count Garbage collection count during the last
collection interval.
garbageCollector | collectionTime Collection Time (ms) Time spent in garbage collection during
the last collection interval.
Database Metrics
In a vApp installation, the vCenter Operations adapter collects metrics for the Postgres database instance.
These metrics are available only in 5.7 and later releases.
Table 6-25. Database Metrics
Metric Key Metric Name Description
postgres | memConsumption Memory Consumption (KB) Memory that Postgres uses.
VMware vCenter Adapter Installation and Configuration Guide
74 VMware, Inc.