
1.0
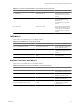
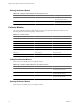
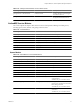
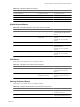
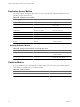


Table Of Contents
- VMware vCenter Adapter Installation and Configuration Guide
- Contents
- VMware vCenter Adapter Installation and Configuration Guide
- Updated Information
- Introduction to the vCenter Adapter
- Installing the vCenter Adapter
- Configuring the vCenter Adapter
- Troubleshooting the vCenter Adapter
- Metrics for vCenter Server Components
- Metrics for vCenter Operations Manager Components
- Index

Table 6-13. Garbage Collector Metrics for the Collector Service
Metric Key Metric Name Description
garbageCollector | collectionCount Collection Count Garbage collection count during the
last collection interval.
garbageCollector | collectionTime Collection Time (ms) Time spent in garbage collection
during the last collection interval.
ActiveMQ Service Metrics
The vCenter Operations adapter collects metrics for the vCenter Operations Manager ActiveMQ service,
including queue, broker, database, and garbage collector metrics.
Table 6-14. ActiveMQ Metrics
Metric Key Metric Name Description
currentHeapSie Current heap size (MB) Current heap size.
MaxHeapSize Max heap size (MB) Maximum heap size.
CommittedMemory Committed memory (MB) Committed memory size.
FreePhysicalMemory Free physical memory Free physical memory.
UsedMemory Used physical memory Used physical memory.
CPUUsage CPU usage (%) Percent CPU use.
Threads Threads Number of threads.
Queue Metrics
Table 6-15. Queue Metrics for the ActiveMQ Service
Metric Key Metric Name Description
Queues | MemoryPercentUsage Used Memory Percentage Percent used memory.
Queues | MemoryLimit Memory Limit Memory limit.
Queues | EnqueueCount Enqueue Count Enqueue count.
Queues | DispatchCount Dispatch Count Dispatch count.
Queues | DequeueCount Dequeue Count Dequeue count.
Queues | ConsumerCount Consumer Count Consumer count.
Queues | QueueSize Queue Size Queue size.
Queues | CursorMemoryUsage Cursor memory usage Cursor memory use.
Queues | CursorFull Cursor Full If the cursor reached its memory limit for
paged messages.
Available only in 5.7 and later releases.
Queues | AverageEnqueueTime Average Enqueue Time (ms) Average amount of time, in milliseconds,
that messages remained in the destination
before being consumed.
Available only in 5.7 and later releases.
Queues | ProductCount Producer Count Number of producers connected to the
destination.
Available only in 5.7 and later releases.
Chapter 6 Metrics for vCenter Operations Manager Components
VMware, Inc. 71