
1.0
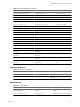
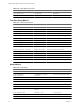
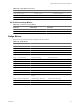


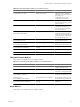
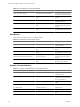
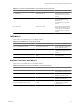
Table Of Contents
- VMware vCenter Adapter Installation and Configuration Guide
- Contents
- VMware vCenter Adapter Installation and Configuration Guide
- Updated Information
- Introduction to the vCenter Adapter
- Installing the vCenter Adapter
- Configuring the vCenter Adapter
- Troubleshooting the vCenter Adapter
- Metrics for vCenter Server Components
- Metrics for vCenter Operations Manager Components
- Index

Table 6-5. Alarm Metrics for the Analytics Service
Metric Key Metric Name Description
alarm | newAlarmOpTime New Alarm Count Op Time (ms) Time spent creating new alarms
during the last collection interval.
alarm | newAlarmOpTimeAvg New Alarm Count Op Time Average
(ms)
Average time spent creating new
alarms.
alarm | newFaultAlarmCount New Fault Alarm Count New fault alarm count during the
last collection interval.
alarm | newFaultAlarmOptime New Fault Alarm Count Op Time
(ms)
Time spent creating new fault
alarms during the last collection
interval.
alarm | canceledAlarmOpTime New Canceled Alarm Count Op Time
(ms)
Time spent canceling alarms
during the last collection interval.
Alert Metrics
These metrics are available only in 5.7 and later releases.
Table 6-6. Alert Metrics for the Analytics Service
Metric Key Metric Name Description
alert | newAlertOpTime New Alert Count Op Time (ms) New alert count during the last
collection interval.
alert | newalertOpTimeAvg New Alert Count Op Time Average
(ms)
Average time spent creating new
alerts.
alert | newfingerPrintGenerationAlertCount New Finger Print Generation Alert
Count
New fingerprint alert count
during the last collection interval.
alert |
newFingerPrintGenerationAlertOpTime
New Finger Print Generation Alert
Count Op Time (ms)
Time spent creating fingerprint
alerts during the last collection
interval.
alert | canceledAlertOptime New Canceled Alert Count Op Time
(ms)
Time spent canceling alerts during
the last collection interval.
Dynamic Threshold Metrics
Table 6-7. Dynamic Threshold Metrics for the Analytics Service
Metric Key Metric Name Description
dt | isRunning Running Value is 1 if dynamic threshold is
currently running.
dt | percentage Percent (%) Finished dynamic threshold
calculation percentage during a
dynamic threshold run.
dt | dtProcessorCount DT Processor Count Dynamic threshold processor
count.
dt | resourceCount Resource Count Resource count.
dt | fsdbReadTime FSDB Read Time (ms) FSDB read time.
dt | dtObjectSaveTime DT Object Save Time (ms) Dynamic threshold save time.
dt | dtHistorySaveTime DT History Save Time (ms) Dynamic threshold history save
time.
VMware vCenter Adapter Installation and Configuration Guide
68 VMware, Inc.