
1.0
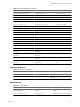
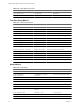
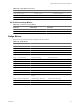


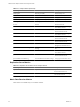
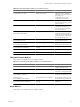
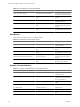
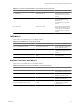
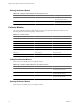
Table Of Contents
- VMware vCenter Adapter Installation and Configuration Guide
- Contents
- VMware vCenter Adapter Installation and Configuration Guide
- Updated Information
- Introduction to the vCenter Adapter
- Installing the vCenter Adapter
- Configuring the vCenter Adapter
- Troubleshooting the vCenter Adapter
- Metrics for vCenter Server Components
- Metrics for vCenter Operations Manager Components
- Index

Metrics for vCenter Operations
Manager Components 6
The vCenter Operations adapter monitors vCenter Operations Manager.
In vCenter Operations Manager 5.6 and later releases, the vCenter Operations adapter collects metrics for
certain vCenter Operations Manager components. These self-monitoring metrics are useful for diagnosing
problems with vCenter Operations Manager.
This chapter includes the following topics:
n
“Analytics Metrics,” on page 65
n
“Collector Metrics,” on page 70
n
“ActiveMQ Service Metrics,” on page 71
n
“Web Server Metrics,” on page 72
n
“Replication Server Metrics,” on page 74
n
“Database Metrics,” on page 74
n
“Host Operating System Metrics,” on page 75
Analytics Metrics
The vCenter Operations adapter collects metrics for the vCenter Operations Manager Analytics service,
including replication
server, data receiver, threshold checker, alarm, alert, dynamic threshold, FSDB, database
connection, and garbage collector metrics.
Table 6-1. Analytics Metrics
Metric Key Metric Name Description
ConfiguredResources Configured Resources Configured resources.
VCConfiguredResources VC Configured Resources Configured vCenter resources.
ActiveAlarms Active Alarms Active alarms.
ActiveAlerts Active Alerts Active alerts.
FingerprintThreads Fingerprint Threads Fingerprint threads.
resourceCacheLoadTime Resource Cache Load Time (ms) Resource cache load time.
Available only in 5.7 and later
releases.
attributeCacheLoadTime Attribute Cache Load Time (ms) Attribute cache load time.
Available only in 5.7 and later
releases.
CurrentHeapSize Current heap size (MB) Current heap size.
VMware, Inc. 65