
Installation guide

Formula: (the number of Port monitoring target machine units) * 20 [sec] / (the
value of Maximum number of parallel processings) < (the value of Maximum time
of one time monitoring)
If the value of the Maximum number of parallel processings is increased, time to
monitor machines at one time becomes short but loads of the management server
increase. If the value of the Maximum time of one time monitoring is increased,
loads of the management server decrease but time to monitor machines at one
time becomes long.
Note: Depending on the number of SystemProvisioning's alive monitoring target
machines and the power status of the machines, the monitoring time can be much
longer. If the monitoring of all the target machines takes longer than the specified
monitoring interval, the following messages are output in the operations log:
periodical alive monitor: Got a slow response x[sec].
And the monitoring interval is x[sec].
Reference: For the setting of monitoring intervals, see Subsection 2.4.9, "Configuring
the Setting of Alive Monitor" in SigmaSystemCenter Configuration Guide.
1.2.4. Events System Monitor - Performance Monitoring
Services Can Detect
System Monitor - Performance Monitoring Services can monitor the load status of a
monitored machine, and send alert as an event to SystemProvisioning when the
machine exceeds the threshold and when the machine recovers. In addition, if you use
the VM Optimized Placement, System Monitor - Performance Monitoring Services
notifies SystemProvisioning of the VM Server high load event when the load of a virtual
machine server exceeds the high load bound, or the VM Server low load event when
the load of a virtual machine server falls below the low load bound. The Event
Categories of events that are notified from System Monitor - Performance Monitoring
Services are as follows.
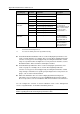
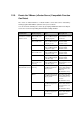
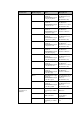
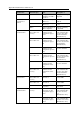
You can check the following error events by specifying "SystemMonitorPerf" in the
Report Source box on the Corresponding Event Handler Settings window.
Event Category Event ID Event Name Description
Customized
Machine Notification
10000001 Customized machine notification1 Performance data of
the target machine
exceeded the threshold
value / recovered from
the excess of the
threshold value. *1
10000002 Customized machine notification2
10000003 Customized machine notification3
10000004 Customized machine notification4
10000005 Customized machine notification5
10000006 Customized machine notification6