
Installation guide
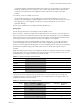
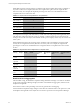
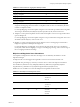
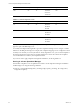
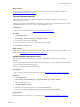
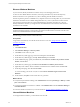
Table Of Contents
- VMware vCenter Configuration Manager Administration Guide
- Contents
- About This Book
- Getting Started with VCM
- Installing and Getting Started with VCM Tools
- Configuring VMware Cloud Infrastructure
- Virtual Environments Configuration
- Configure Virtual Environments Collections
- Configure Managing Agent Machines for Virtual Environment Management
- Obtain the SSL Certificate Thumbprint
- Configure vCenter Server Data Collections
- Configure vCenter Server Virtual Machine Collections
- Configure vCloud Director Collections
- Configure vCloud Director vApp Virtual Machines Collections
- Configure vShield Manager Collections
- Configure ESX Service Console OS Collections
- Configure the vSphere Client VCM Plug-In
- Running Compliance for the VMware Cloud Infrastructure
- Create and Run Virtual Environment Compliance Templates
- Create Virtual Environment Compliance Rule Groups
- Create and Test Virtual Environment Compliance Rules
- Create and Test Virtual Environment Compliance Filters
- Preview Virtual Environment Compliance Rule Groups
- Create Virtual Environment Compliance Templates
- Run Virtual Environment Compliance Templates
- Create Virtual Environment Compliance Exceptions
- Resolve Noncompliant Virtual Environments Template Results
- Configure Alerts and Schedule Virtual Environment Compliance Runs
- Configuring vCenter Operations Manager Integration
- Auditing Security Changes in Your Environment
- Configuring Windows Machines
- Configure Windows Machines
- Windows Collection Results
- Getting Started with Windows Custom Information
- Prerequisites to Collect Windows Custom Information
- Using PowerShell Scripts for WCI Collections
- Windows Custom Information Change Management
- Collecting Windows Custom Information
- Create Your Own WCI PowerShell Collection Script
- Verify that Your Custom PowerShell Script is Valid
- Install PowerShell
- Collect Windows Custom Information Data
- Run the Script-Based Collection Filter
- View Windows Custom Information Job Status Details
- Windows Custom Information Collection Results
- Run Windows Custom Information Reports
- Troubleshooting Custom PowerShell Scripts
- Configuring Linux, UNIX, and Mac OS X Machines
- Linux, UNIX, and Mac OS X Machine Management
- Linux, UNIX, or Mac OS X Installation Credentials
- Configure Collections from Linux, UNIX, and Mac OS X Machines
- Configure Installation Delegate Machines to Install Linux, UNIX, and Mac OS X...
- Configure the HTTPS Bypass Setting for Linux Agent Installations
- Enable Linux, UNIX, and Mac OS X Agent Installation
- Add and License Linux, UNIX, and Mac OS X Machines for Agent Installation
- Install the VCM Agent on Linux, UNIX, and Mac OS X Operating Systems
- Collect Linux, UNIX, and Mac OS X Data
- Linux, UNIX, and Mac OS X Collection Results
- Configure Scheduled Linux, UNIX, and Mac OS X Collections
- Patching Managed Machines
- Patch Assessment and Deployment
- Prerequisite Tasks and Requirements
- Manually Patching Managed Machines
- Getting Started with VCM Manual Patching
- Configuring An Automated Patch Deployment Environment
- Deploying Patches with Automated Patch Assessment and Deployment
- Configure VCM for Automatic Event-Driven Patch Assessment and Deployment
- Generate a Patch Assessment Template
- Run a Patch Assessment on Managed Machines
- Add Exceptions for Patching Managed Machines
- Configure the VCM Administration Settings
- Generate a Patch Deployment Mapping
- Configure VCM for Automatic Scheduled Patch Assessment and Deployment
- How the Linux and UNIX Patch Staging Works
- How the Linux and UNIX Patching Job Chain Works
- How the Deploy Action Works
- Patch Deployment Wizards
- Running Patching Reports
- Running and Enforcing Compliance
- Provisioning Physical or Virtual Machine Operating Systems
- Provisioning Software on Managed Machines
- Using Package Studio to Create Software Packages and Publish to Repositories
- Software Repository for Windows
- Package Manager for Windows
- Software Provisioning Component Relationships
- Install the Software Provisioning Components
- Using Package Studio to Create Software Packages and Publish to Repositories
- Using VCM Software Provisioning for Windows
- Related Software Provisioning Actions
- Configuring Active Directory Environments
- Configuring Remote Machines
- Tracking Unmanaged Hardware and Software Asset Data
- Managing Changes with Service Desk Integration
- Index

Templates in Mappings Score Results
Mapping 1 Template 1 80 10,000
Mapping 1 Template 2 50 5
Mapping 1 Template 3 100 1
Mapping 2 Template 4 30 100
Mapping 2 Template 5 75 500
Table 5–5. Detail Level Score Aggregation Example Values
n
Compliance Result: To roll up at the compliance result level means that the scores for the templates
assigned to the mapping, times the number of compliance results for each score divided by the total
number of compliance results.
For example, Mapping 1 has three templates using the scores and results provided in the Scoring table.
The scoring is calculated as (80*10,000)+(50*5)+(100*1)/(10,000+5+1)=80, where 80 is the score.
n
Template: To roll up at the template level means that each template's scores are averaged when rolled
up to the badge level.
For example, Mapping 1 has three templates using the scores provided in the Scoring table. The score is
calculated as (80+50+100)/3=77, where 77 is the score.
n
Mapping: To roll up at the mapping level means that the score for each mapping associated with a
badge is averaged when rolled up to the badge level.
For example, Mapping 1 and Mapping 2 are assigned to the same badge. The score is calculated as
(77+53)/2=65, where 77 is the Mapping 1 average, 53 is the Mapping 2 average, and 65 is the average of
the two mappings included in the badge.
Midpoint and Magnitude Score Calculations
Use midpoint and magnitude to refine how the badge scores are ultimately calculated for vCenter
Operations Manager.
n
Midpoint: The score that triggers the magnitude to increase or decrease the returned score.
n
Magnitude: The percentage by which any score that is above or below the midpoint is calculated.
The calculation is {detail level score}-{midpoint}={difference}; {difference}*{magnitude}={adjusted
magnitude factor}; {detail level score}+{adjusted magnitude factor}={adjusted score}.
Detail level scores can differ even where the midpoint and magnitude remain the same.
Detail Level Score Midpoint Magnitude Calculation Adjusted Score
20 50 10 20-50=-30
-30*10%=-3
20-3=17
17
40 50 10 40-50=-10
-10*10%=-1
40-1=39
39
70 50 10 70-50=20
20*10%=2
70+2=72
72
Table 5–6. Static Midpoint and Magnitude Values
Configuring vCenter Operations Manager Integration
VMware, Inc.
83