
Installation guide
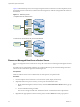


Table Of Contents
- vSphere Basic System Administration
- Contents
- Updated Information
- About This Book
- Getting Started
- vSphere Components
- Starting and Stopping the vSphere Components
- Using vCenter Server in Linked Mode
- Linked Mode Prerequisites
- Linked Mode Considerations
- Join a Linked Mode Group After Installation
- Reconciling Roles When Connecting vCenter Server to a Linked Mode Group
- Isolate a vCenter Server Instance from a Linked Mode Group
- Change the Domain of a vCenter Server System in a Linked Mode Group
- Configure the URLs on a Linked Mode vCenter Server System
- Linked Mode Troubleshooting
- Monitor vCenter Server Services
- Using the vSphere Client
- Configuring Hosts and vCenter Server
- Host Configuration
- Configuring vCenter Server
- Access the vCenter Server Settings
- Configuring Communication Among ESX, vCenter Server, and the vSphere Client
- Configure vCenter Server SMTP Mail Settings
- Working with Active Sessions
- SNMP and vSphere
- System Log Files
- Managing the vSphere Client Inventory
- Managing Hosts in vCenter Server
- Virtual Machine Management
- Consolidating the Datacenter
- Consolidation First Time Use
- Consolidation Prerequisites
- About Consolidation Services
- Configuring Consolidation Settings
- Find and Analyze Physical Systems
- Viewing Analysis Results
- Converting Physical Systems to Virtual Machines
- Viewing Consolidation Tasks
- Troubleshooting Consolidation
- Negative Impact on vCenter Server Performance
- Windows Systems Not Discovered
- Windows Operating Systems Prevent Guided Consolidation from Collecting Performance Data
- Available Domains List Remains Empty
- Guided Consolidation Erroneously Reports Analysis Disabled
- Disable Guided Consolidation
- Uninstall Guided Consolidation
- Deploying OVF Templates
- Managing VMware vApp
- Creating Virtual Machines
- Access the New Virtual Machine Wizard
- Select a Path Through the New Virtual Machine Wizard
- Enter a Name and Location
- Select a Resource Pool
- Select a Datastore
- Select a Virtual Machine Version
- Select an Operating System
- Select the Number of Virtual Processors
- Configure Virtual Memory
- Configure Networks
- About VMware Paravirtual SCSI Adapters
- Select a SCSI Adapter
- Selecting a Virtual Disk Type
- Complete Virtual Machine Creation
- Installing a Guest Operating System
- Installing and Upgrading VMware Tools
- Install VMware Tools on a Windows Guest
- Install VMware Tools on a Linux Guest from the X Window System
- Install or Upgrade VMware Tools on a Linux Guest with the tar Installer
- Install or Upgrade VMware Tools on a Linux Guest with the RPM Installer
- Install VMware Tools on a Solaris Guest
- Install VMware Tools on a NetWare Guest
- Display the VMware Tools Properties Dialog Box
- VMware Tools Upgrades
- Upgrade VMware Tools Manually
- Configure Virtual Machines to Automatically Upgrade VMware Tools
- Custom VMware Tools Installation
- WYSE Multimedia Support
- Managing Virtual Machines
- Changing Virtual Machine Power States
- Transitional Power States
- Automatically Start or Shutdown Virtual Machines with Host Start or Shutdown
- Configure vSphere Toolbar Power Controls
- Power On or Power Off a Virtual Machine Manually
- Suspend a Virtual Machine
- Resume a Suspended Virtual Machine
- Scheduling a Power State Change for a Virtual Machine
- Adding and Removing Virtual Machines
- Configure Virtual Machine Startup and Shutdown Behavior
- Changing Virtual Machine Power States
- Virtual Machine Configuration
- Virtual Machine Hardware Versions
- Virtual Machine Properties Editor
- Edit an Existing Virtual Machine Configuration
- Virtual Machine Hardware Configuration
- Change the Video Card Configuration
- Change the DVD/CD-ROM Drive Configuration
- Change the Floppy Drive Configuration
- Change the SCSI Device Configuration
- Change the Virtual Disk Configuration
- Change the Memory Configuration
- Change the Virtual Ethernet Adapter (NIC) Configuration
- Change the Parallel Port Configuration
- Change the SCSI Controller or SCSI Bus Sharing Configuration
- Change the Serial Port Configuration
- Change the Virtual Processor or CPU Configuration
- Virtual Machine Options
- Virtual Machine Resource Settings
- Adding New Hardware
- Rescan a Host
- Start the Add Hardware Wizard
- Add a Serial Port to a Virtual Machine
- Add a Parallel Port to a Virtual Machine
- Add a DVD/CD-ROM Drive to a Virtual Machine
- Add a Floppy Drive to a Virtual Machine
- Add an Ethernet Adapter (NIC) to a Virtual Machine
- Add a Hard Disk to a Virtual Machine
- Add a SCSI Device to a Virtual Machine
- Add a PCI Device
- Add a Paravirtualized SCSI Adapter
- Converting Virtual Disks from Thin to Thick
- Working with Templates and Clones
- Customizing Guest Operating Systems
- Preparing for Guest Customization
- Customize Windows During Cloning or Deployment
- Customize Linux During Cloning or Deployment
- Create a Customization Specification for Linux
- Create a Customization Specification for Windows
- Managing Customization Specification
- Completing a Guest Operating System Customization
- Migrating Virtual Machines
- Cold Migration
- Migrating a Suspended Virtual Machine
- Migration with VMotion
- Host Configuration for VMotion
- CPU Compatibility and Migration
- Virtual Machine Configuration Requirements for VMotion
- Migrating Virtual Machines with Snapshots
- Migration with Storage VMotion
- Migrate a Powered-Off or Suspended Virtual Machine
- Migrate a Powered-On Virtual Machine with VMotion
- Migrate a Virtual Machine with Storage VMotion
- Storage VMotion Command-Line Syntax
- Using Snapshots
- Consolidating the Datacenter
- System Administration
- Managing Users, Groups, Roles, and Permissions
- Managing vSphere Users
- Groups
- Removing or Modifying Users and Groups
- Best Practices for Users and Groups
- Using Roles to Assign Privileges
- Permissions
- Best Practices for Roles and Permissions
- Required Privileges for Common Tasks
- Monitoring Storage Resources
- Using vCenter Maps
- Working with Alarms
- Working with Performance Statistics
- Working with Tasks and Events
- Managing Users, Groups, Roles, and Permissions
- Appendixes
- Defined Privileges
- Alarms
- Datacenter
- Datastore
- Distributed Virtual Port Group
- Distributed Virtual Switch
- Extensions
- Folders
- Global
- Host CIM
- Host Configuration
- Host Inventory
- Host Local Operations
- Host Profile
- Network
- Performance
- Permissions
- Resource
- Scheduled Task
- Sessions
- Tasks
- vApp
- Virtual Machine Configuration
- Virtual Machine Interaction
- Virtual Machine Inventory
- Virtual Machine Provisioning
- Virtual Machine State
- Installing the Microsoft Sysprep Tools
- Performance Metrics
- Defined Privileges
- Index

If a component is functioning normally, the status indicator is green. The status indicator changes to yellow
or red if a system component violates a performance threshold or is not functioning properly. Generally, a
yellow indicator signifies degraded performance. A red indicator signifies that a component stopped operating
or exceeded the highest threshold. If the status is blank, then the health monitoring service cannot determine
thae status of the component.
The Reading column displays the current values for the sensors. For instance, the column displays rotations
per minute (RPM) for fans and degrees Celsius for temperature.
Monitor Health Status When Connected to vCenter Server
When you connect the vSphere Client to vCenter Server, you can view the health status from the Hardware
Status tab.
When you are connected to a host through vCenter Server, you must use the Hardware Status tab to monitor
the host health.
Prerequisites
To use the Hardware Status tab, you must enable vCenter Hardware Status plug-in.
Procedure
1 Log in to a vCenter Server system using the vSphere Client, and display the Hosts and Clusters view in
the inventory.
2 Select the host in the inventory and click the Hardware Status tab.
3 From the View dropdown menu, select the type of information to view.
Option Description
Sensors
Displays all sensors arranged in a tree view. If the status is blank, then the
health monitoring service cannot determine the status of the component.
n
Click Show all sensors to expand the tree view to show all sensors under
each group.
n
Click Show all details to expand the tree view to show descriptive details
for every sensor.
n
Click Hide all to collapse the tree view to show only the sensor groups.
Alerts and warnings
Displays only alerts and warnings.
System event log
Displays the system event log.
Click Reset event log to clear the event log.
vSphere Basic System Administration
84 VMware, Inc.