
User`s guide
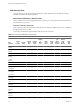
Table Of Contents
- VMware vCenter AppSpeed User’s Guide
- Contents
- About This Book
- AppSpeed Overview
- Viewing Performance Data
- AppSpeed Topology Overview
- AppSpeed Administration
- Event Management
- Troubleshooting Errors While Using AppSpeed
- Index

Display or Hide Latency Standard Deviation Indicators
Latency indicators show the standard deviation for latency on graphs in some views. By default, this feature
is hidden.
Procedure
u
In the tabular display pane, click the graph icon on the right to display or hide latency standard deviation
indicators.
What to do next
You can view the standard deviation values in a pop-up window by placing your pointer on a deviation
indicator.
Performance Indicators
Performance is monitored by AppSpeed across a wide range of metrics. The performance indicators displayed
vary according to the selected view.
Table 2-3 lists the performance indicators that AppSpeed monitors.
Table 2-3. AppSpeed Performance Indicators
Performance Indicator Description
Average Latency Measured time between the start of the client request to the end of the server reply, averaged
across all hits in the specified time frame. A greater value means a slower server response.
Average Reply Size Average size, in bytes, of a single server reply, averaged across all hits in the specified time
frame.
Average Throughput Average number of reply bytes per second in the specified time frame.
Error Percentage Percentage of error hits as a portion of the total hits in the specified time frame.
Execution Time Sum of all latencies in the specified time frame. This value reflects the total amount of time
of all server replies in the specified time frame.
Hit Rate Average number of hits per second in the specified time frame.
Latency Baseline Average latency of all hits since the time AppSpeed Server started running.
Latency Breakdown
n
Server: Latency measured from the time the server receives a request until it starts to
transmit a reply.
n
Network Time: Cost of transmitting packets in the network without failures.
n
Network Retransmissions: Cost of packet retransmissions, errors, and drops.
n
Client Fetch: Time from when the client receives a reply until it transmits the next Oracle
Client Fetch request.
Latency % of Baseline Percentage of latency above or below the baseline.
Latency STDEV Standard deviation of the latency of all of the hits in the specified time frame.
Max. Latency Latency of the slowest hit in the specified time frame.
SLA percentage Percentage of hits that were not errors and that had latency within SLA levels.
Total Errors Total number of hits identified as errors in the specified time frame.
Total Hits Total number of hits in the specified time frame.
Total Throughput Total number of reply bytes in the specified time frame.
Chapter 2 Viewing Performance Data
VMware, Inc. 19