
User Manual
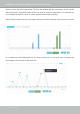
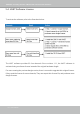
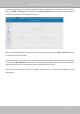
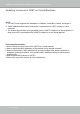
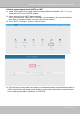

Table Of Contents
- Revision History
- Chapter One Hardware Installation and Initial Configuration
- Chapter Two VAST2 Software Configuration and Management
- Log in
- Introducing VAST2
- Charged Add-on Features
- Installation Option - OpenVPN
- Chapter 2-1 Basics: Control and Elements
- Hot Keys
- View Cell Elements
- VAST Server and Client Components
- Minimum System Requirements
- Chapter 2-2 Starting Up
- 2-2-1. Selecting Devices
- 2-2-2. Recording Options
- 2-2-3. Storage
- 2-2-4. Starting Up - Main Page
- 2-2-5. Saving a View
- 2-2-6. Add More Live Views
- 2-2-7. Save Your Preferences
- 2-2-8. Customizable Layout
- 2-2-9. Dashboard
- 2-2-10. E-Map
- Placing DI/DO Devices
- Configuring Google Map and GPS
- 2-2-11. Event Search
- 2-2-12. PTZ Control
- 2-2-13. Playback
- 2-2-14. Alarm
- 2-2-15. Search Panel
- 2-2-16. Smart search
- 2-2-17. Tour
- 2-2-18. Thumbnail search
- Chapter 3 Applications:
- 3-1. I/O DI/DO Devices: IO Box and Related Configuration
- Configuring I/O Box DI/DO as a Trigger or Action in Alarm
- 3-2. Configuring Redundant Servers - Failover
- Failover Configuration Process
- 3-3. VCA (Video Content Analysis)
- 3-4. VAST Software License
- Updating Licenses for VAST on Virtual Machines
- Reminders for VAST Software License
- Chapter 4 Settings:
- 4-1. Settings > System > Preferences
- 4-2. Settings > Device > Cameras
- 4-3. Logical Folders
- 4-4. Settings > Recording > Recording Options
- 4-5. Settings > Recording > Backup
- Storage
- 4-6. Settings > Device > Sites
- 4-7. Settings > Device > POS
- 4-8. Settings > Device > Local DB
- 4-9. Settings > System > SMTP
- 4-10. Settings > IO Box and Related Configuration
- 4-11. Settings > User Management
- Add a New User Account - Windows AD Account
- Appendix A: VAST Service Control Tool
- Appendix B: Matrix
- Appendix C: Joystick Support
- Appendix D: Upload Device Pack
- Appendix E Database Merge Function

VIVOTEK - A Leading Provider of Multimedia Communication Solutions
172 - User's Manual
Data on a time line will be generated. To close the window, use the close button on the second
date information. Equivalent spans of time can also be used for comparison. For example, you
can compare the data in a span of 4 days against another span of 4 days.
Note that the Compare function only applies when you select to display only one area on screen.
In a comparison result displayed in a line chart, mouse over to the peak value to display the
percentage of an increase or decrease rate.