
User Manual
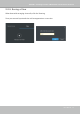
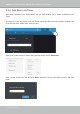
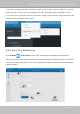
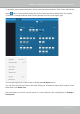
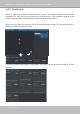
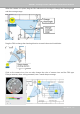
Table Of Contents
- Revision History
- Chapter One Hardware Installation and Initial Configuration
- Chapter Two VAST2 Software Configuration and Management
- Log in
- Introducing VAST2
- Charged Add-on Features
- Installation Option - OpenVPN
- Chapter 2-1 Basics: Control and Elements
- Hot Keys
- View Cell Elements
- VAST Server and Client Components
- Minimum System Requirements
- Chapter 2-2 Starting Up
- 2-2-1. Selecting Devices
- 2-2-2. Recording Options
- 2-2-3. Storage
- 2-2-4. Starting Up - Main Page
- 2-2-5. Saving a View
- 2-2-6. Add More Live Views
- 2-2-7. Save Your Preferences
- 2-2-8. Customizable Layout
- 2-2-9. Dashboard
- 2-2-10. E-Map
- Placing DI/DO Devices
- Configuring Google Map and GPS
- 2-2-11. Event Search
- 2-2-12. PTZ Control
- 2-2-13. Playback
- 2-2-14. Alarm
- 2-2-15. Search Panel
- 2-2-16. Smart search
- 2-2-17. Tour
- 2-2-18. Thumbnail search
- Chapter 3 Applications:
- 3-1. I/O DI/DO Devices: IO Box and Related Configuration
- Configuring I/O Box DI/DO as a Trigger or Action in Alarm
- 3-2. Configuring Redundant Servers - Failover
- Failover Configuration Process
- 3-3. VCA (Video Content Analysis)
- 3-4. VAST Software License
- Updating Licenses for VAST on Virtual Machines
- Reminders for VAST Software License
- Chapter 4 Settings:
- 4-1. Settings > System > Preferences
- 4-2. Settings > Device > Cameras
- 4-3. Logical Folders
- 4-4. Settings > Recording > Recording Options
- 4-5. Settings > Recording > Backup
- Storage
- 4-6. Settings > Device > Sites
- 4-7. Settings > Device > POS
- 4-8. Settings > Device > Local DB
- 4-9. Settings > System > SMTP
- 4-10. Settings > IO Box and Related Configuration
- 4-11. Settings > User Management
- Add a New User Account - Windows AD Account
- Appendix A: VAST Service Control Tool
- Appendix B: Matrix
- Appendix C: Joystick Support
- Appendix D: Upload Device Pack
- Appendix E Database Merge Function

VIVOTEK - A Leading Provider of Multimedia Communication Solutions
106 - User's Manual
2-2-9. Dashboard
Select to open the Dashboard utility from the tool bar. The Dashboard displays the system
resources of a CMS server along with those of its sub-stations. This provides a glimpse of the
load on machines when performing the recording and monitoring tasks.
Mouse over the edge of the bottom row to reveal the expansion mark. Pull the status row up to
display the system resource statuses.
If you have multiple LAN cards or virtual HBAs, the status row can be pulled to reveal all of their
statuses.