
User manual


Phantom Help File202
© 2010 Vision Research - An AMETEK Company
then
b)
Enter the required Rate.
4)
Under the Cine Settings selector, note the Duration time.
5)
Repeat Steps 3, 4, and 5 until all the profiles have been defined.
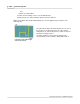
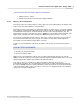
RESULT: The Frame Rate Profile Graph displays the an active graphical representation of the
defined profiles.
Frame Rate Profile Graph Example
with 5 profiles defined
The yellow line indicates the defined frame rates for each of
the profiles. The starting point of the line represents the
Sample Rate set, and used by Profile 1, under Live Control
Panel>Cine Settings Selector.
The white dotted lines represent the beginning of the
specified Image or Time variables starting with Profile 2.