
Brochure


Varistors Introduction
TECHNICAL NOTE
Technical Note
www.vishay.com
Vishay BCcomponents
Revision: 04-Sep-13
5
Document Number: 29079
For technical questions, contact: nlr@vishay.com
THIS DOCUMENT IS SUBJECT TO CHANGE WITHOUT NOTICE. THE PRODUCTS DESCRIBED HEREIN AND THIS DOCUMENT
ARE SUBJECT TO SPECIFIC DISCLAIMERS, SET FORTH AT www.vishay.com/doc?91000
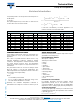
Definitions of the varistor curve
The points A, B and C shown on the curve are defined in the
Varistor Curve Definitions table.
TRANSIENT VOLTAGE LIMITATIONS WITH ZnO
VARISTORS
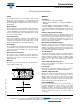
Principles of voltage limitation
Voltage limitation using a varistor
In the Voltage limitation using a varistor drawing above, the
supply voltage V
I
is derived by the resistance R (e.g. the line
resistance) and the varistor (-U) selected for the application.
V
I
= V
R
+ V
O
V
I
= R x I + C x I
If the supply voltage varies by an amount of V
I
the current
variation is I and the supply voltage may be expressed as:
(V
I
+ V
I
) = R (I + I) + C (I + I)
Given the small value of (0.03 to 0.05), it is evident that the
modification of C xI
will be very small compared to the
variation of R x I when V
I
is increased to V
I
+ V
I
.
A large increase of V
I
will induce a large increase of V
R
and
a small increase of V
O
.
Examples
The varistor is a typical component of the series
VDR05C275 (C = 520; = 0.04) and R = 250 .
For V
I
= 315 V (crest voltage of the 220 V supply voltage):
I = 10
-5
A, V
R
= 2.5 x 10
-3
V and V
O
= 315 V
For V
I
= 500 V: I = 10
-1
A, V
R
= 25 V and V
O
= 475 V
For V
I
= 1000 V: I = 1.88 A, V
R
= 470 V and V
O
= 530 V
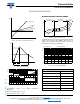
The influence of a series resistance on the varistor drawing
shows the influence of different values of series resistors on
the varistor efficiency.
By drawing the load line, it is also possible to estimate the
variation of the voltages V
R
and V
O
when V
I
is increased to
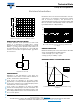
500 V or 1000 V. This effect is shown in the graphs below.
Influence of a series resistance on the varistor
Influence on varistor when V
1
is 500 V (R = 250 )
VARISTOR CURVE DEFINITIONS
POINT DESCRIPTION
A
Normal working zone: current is kept as low as
possible in order to have low dissipation during
continuous operation (between 10 μA to 300 μA).
B
Maximum clamping voltage: the maximum voltage
for a given (class) current (peak current based upon
statistical probability determined by standardization
authorities).
C
Maximum withstanding surge current: the maximum
peak current that the varistor can withstand (only)
once in its lifetime.
10 µA 300 µA
10 A 1000 A
100 A
protection zone
normal
working
condition
(no spike)
log V
AB C
I
R
I
- U
V
I
V
R
V
O
V
O
(V)
2500
2000
1500
1000
500
2500
2000
1500
1000500
V
I
(V)
R = 0 Ω
1 Ω
0.1 Ω
10 Ω
1000 Ω
100 Ω
V
R
V
O
V
1
V
(V)
1000
800
600
400
200
0
02
I (A)
46
810