
Brochure


Varistors Introduction
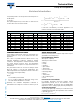
TECHNICAL NOTE
Technical Note
www.vishay.com
Vishay BCcomponents
Revision: 04-Sep-13
4
Document Number: 29079
For technical questions, contact: nlr@vishay.com
THIS DOCUMENT IS SUBJECT TO CHANGE WITHOUT NOTICE. THE PRODUCTS DESCRIBED HEREIN AND THIS DOCUMENT
ARE SUBJECT TO SPECIFIC DISCLAIMERS, SET FORTH AT www.vishay.com/doc?91000
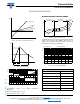
Varistor characteristics using different values
Maximum energy curve
Typical V/I curve
Pre-breakdown region: V I; highly temperature
dependent
Normal operating region: V = C x I
Up-turn region: V = C x I
+ I x R
s
SPCIFICATION OF A VARISTOR CURVE
Working points on a varistor curve
The drawing below shows the various working points on the
varistor curve using the series VDRS07, 60 V type as an
example. The electrical characteristic values are shown in
the Electrical Characteristics table below.
Curve for varistor type VDRS07H060
log V
β = 1 = fixed resistor
β = 0.4 (SiC)
β = 0.03 (ZnO)
β = 0 = ideal varistor
log I
t
t
2
t
1
I
peak
(%)
90
100
50
10
pre-breakdown region normal operating region up-turn region
10
3
10
2
10
10
-8
10
-7
10
-6
10
-5
10
-4
10
-3
10
-2
10
-1
110
10
2
10
3
10
4
10
5
V
(V)
I (A)
10
9
Ω
SLOPE = β
V = Cl
β
V = Cl
β
+ IR
S
R
S
= 0.05 Ω to 0.5 Ω
ELECTRICAL CHARACTERISTICS
PARAMETER VALUE
Maximum RMS voltage 60 V
Maximum DC working voltage 2 x 60 V = 85 V
Varistor voltage 100 V ± 10 %
Maximum clamping voltage at 10 A 165 V
Maximum non-repetitive current 1200 A
Leakage current at 85 V
DC
10
-5
A to 5 x 10
-4
A
Transient energy 10 µs to 1000 µs: 8.3 J
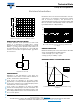
log V
log I1 mA
max. leakage
current region
max. clamping
voltage region
up-turn
region
max.
clamping
voltage
max.
leakage current
tolerance band
+ 10 %
- 10 %
10
3
10
2
10
10
-5
10
-4
10
-3
10
-2
10
-1
110
10
2
10
3
V
(V)
I (A)
max. leakage current max. clamping voltage