
Datasheet

New Product
UH10FT & UHB10FT
Vishay General Semiconductor
Document Number: 88963
Revision: 13-May-08
For technical questions within your region, please contact one of the following:
PDD-Americas@vishay.com
, PDD-Asia@vishay.com, PDD-Europe@vishay.com
www.vishay.com
3
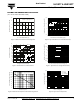
RATINGS AND CHARACTERISTICS CURVES
(T
A
= 25 °C unless otherwise noted)
Figure 1. Maximum Forward Current Derating Curve
Figure 2. Forward Power Loss Characteristics
Figure 3. Maximum Non-Repetitive Peak Forward Surge Current
0
3
6
9
12
15
0 25 50 75 100 125 150 175
T
C
- Case Temperature (°C)
Average Forward Current (A)
Resistive or Inductive Load
0
1
2
3
4
5
6
7
8
9
10
11
12
02468 10 12
Average Forward Current (A)
Average Power Loss (W)
D = 0.3
D = 0.5
D = 0.8
D = 1.0
D = 0.2
D = 0.1
D = t
p
/T t
p
T
20
40
60
80
100
120
140
160
180
200
1 10 100
Number of Cycles
Peak Forward Surge Current (A)
T
J
= T
J
Max.
10 ms Single Half Sine-Wave
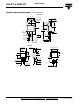
Figure 4. Typical Instantaneous Forward Characteristics
Figure 5. Typical Reverse Leakage Charactersitics
Figure 6. Typical Junction Capacitance
0.1
1
10
100
0.2 0.3 0.4 0.5 0.6 0.7 0.8 0.9 1.0 1.1 1.2 1.3 1.4 1.5
Instantaneous Forward Voltage (V)
Instantaneous Forward Current (A)
T
J
= 125 °C
T
J
= 175 °C
T
J
= 25 °C
0.001
0.01
0.1
1
10
100
1000
10 20 30 40 50 60 70 80 90 100
Percent of Rated Peak Reverse Voltage (%)
Instantaneous Reverse Current (µA)
T
J
= 125 °C
T
J
= 175 °C
T
J
= 25 °C
1
10
100
1000
0.1 1 10 100
Reverse Voltage (V)
Junction Capacitance (pF)
T
J
= 25 °C
f = 1.0 MHz
V
sig
= 50 mVp-p