
Datasheet

VISHAY
TDSG / O / Y51..
Document Number 83126
Rev. 1.5, 31-Aug-04
Vishay Semiconductors
www.vishay.com
3
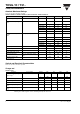
Yellow
TDSY5150/5160
Note
1)
I
Vmin
and I
V
groups are mean values of all segments (a to g, D1 to D4),
matching factor within segments is ≥ 0.5, excluding decimal points and colon.
Green
TDSG5150/5160
Note
1)
I
Vmin
and I
V
groups are mean values of all segments (a to g, D1 to D4),
matching factor within segments is ≥ 0.5, excluding decimal points and colon.
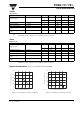
Typical Characteristics (T
amb
= 25 °C unless otherwise specified)
Parameter Test condition Symbol Min Ty p. Max Unit
Luminous intensity per segment
(digit average)
1)
I
F
= 10 mA I
V
700 µcd
I
V
700 µcd
Dominant wavelength I
F
= 10 mA λ
d
581 594 nm
Peak wavelength I
F
= 10 mA λ
p
585 nm
Angle of half intensity I
F
= 10 mA ϕ ±50 deg
Forward voltage per segment
or DP
I
F
= 20 mA V
F
2.4 3 V
Reverse voltage per segment
or DP
I
R
= 10 µAV
R
615 V
Parameter Test condition Symbol Min Ty p. Max Unit
Luminous intensity per segment
(digit average)
1)
I
F
= 10 mA I
V
700 µcd
I
V
700 µcd
Dominant wavelength I
F
= 10 mA λ
d
562 575 nm
Peak wavelength I
F
= 10 mA λ
p
565 nm
Angle of half intensity I
F
= 10 mA ϕ ±50 deg
Forward voltage per segment
or DP
I
F
= 20 mA V
F
2.4 3 V
Reverse voltage per segment
or DP
I
R
= 10 µAV
R
615 V
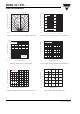
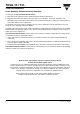
Figure 1. Power Dissipation vs. Ambient Temperature
0
200
400
600
800
1000
P - Power Dissipation ( mW )
V
100806040200
95 11481
T
amb
- Ambient Temperature ( ° C)
Figure 2. Forward Current vs. Ambient Temperature
0
10
20
30
40
60
0204060 80
I - Forward Current ( mA )
F
T
amb
- Ambient Temperature ( ° C)
100
17525
50