
Datasheet

NTCS....E3...SMT
www.vishay.com
Vishay BCcomponents
Revision: 05-Jun-2018
2
Document Number: 29151
For technical questions, contact: nlr@vishay.com
THIS DOCUMENT IS SUBJECT TO CHANGE WITHOUT NOTICE. THE PRODUCTS DESCRIBED HEREIN AND THIS DOCUMENT
ARE SUBJECT TO SPECIFIC DISCLAIMERS, SET FORTH AT www.vishay.com/doc?91000
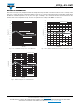
RELIABILITY INFORMATION
After a test of storage at any temperature within the temperature range, the drift of electrical resistance at 25 °C is always lower
than ± 0.5 %, which represents a temperature drift less than ± 0.1 °C (see here under typical figures for drift after storage during
10 000 h at maximal temperature 125 °C). The same type of stability is also observed in thermal shocks between the two
extreme values of the temperature range. The tests are performed according to IEC 60068-2-2 and 2-14.
Fig. 1 - R
25 °C
Drift after Storage at 125 °C for 0603 Case
Fig. 2 - Drift in Storage at 125 °C for 0402 Case
Fig. 3 - R
25 °C
Drift in Thermal Shocks -40 °C, 15 min/125 °C, 15 min
-0.6
-0.5
-0.4
-0.3
-0.2
-0.1
0.0
0.1
0.2
0.3
0.4
0.5
0.6
ΔR
25
/R
25
(%)
Time (h)
0 2000 4000 6000 8000 10 000
Positive threshold
Negative threshold
Min. measureddrift
Max. measured drift
Average measureddrift
-0.6
-0.5
-0.4
-0.3
-0.2
-0.1
0.0
0.1
0.2
0.3
0.4
0.5
0.6
ΔR
25
/R
25
(%)
Time (h)
0 2000 4000 6000 8000 10 000
Positive threshold
Negative threshold
Average measureddrift
Max. measured drift
Min. measureddrift
Nr Cycles
-0.6
-0.5
-0.4
-0.3
-0.2
-0.1
0.0
0.1
0.2
0.3
0.4
0.5
0.6
ΔR
25
/R
25
(%)
0 250 20001750150012501000750500
Negative threshold
Positive threshold
Averagedrift R
25
Max. drift R
25
Min. drift R
25