
Datasheet

NTCLE203E3
www.vishay.com
Vishay BCcomponents
Revision: 26-Jun-17
2
Document Number: 29048
For technical questions, contact: nlr@vishay.com
THIS DOCUMENT IS SUBJECT TO CHANGE WITHOUT NOTICE. THE PRODUCTS DESCRIBED HEREIN AND THIS DOCUMENT
ARE SUBJECT TO SPECIFIC DISCLAIMERS, SET FORTH AT www.vishay.com/doc?91000
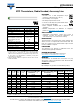
DIMENSIONS in millimeters DERATING AND LONG TERM STABILITY
Power derating curve
Note
• Zero power is considered as measuring power max. 1 % of max.
power
LONG TERM STABILITY OF
R
25
AS A FUNCTION OF TEST DURATION AT MAXIMUM TEMPERATURE (150 °C)
Curves valid for 2.2 kΩ to 10 kΩ. Curve 1, 2 and 3 as max., average, and min. % drift on R
25
LONG TERM STABILITY OF
T AS A FUNCTION OF TEST DURATION AT MAXIMUM TEMPERATURE (150 °C)
Curves valid for 2.2 kΩ to 10 kΩ. Curve 1, 2, and 3 as min., average, and max. temperature deviation
6.0 max.
40
± 1.5
3.6 max.
3
max.
2.54
2 ± 1.0
0.4 ± 0.04
I
II
I
II
0 55 - 40 85 150
T
amb
(°C)
100
0
P
(%)
0.4
0.2
0
10
4
10
3
10
2
25
(%)
Test Duration (h)
3
2
1
- 0.2
R
R
25
0.05
0
- 0.05
- 0.1
10
4
10
3
10
2
Test Duration (h)
3
2
1
T
(K)