
Datasheet

MBRA140TR
Bulletin PD-20582 rev. C 03/03
3
www.irf.com
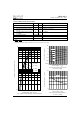
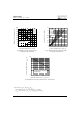
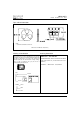
Fig. 2 - Typical Peak Reverse Current
Vs. Reverse Voltage
Fig. 3 - Typical Junction Capacitance
Vs. Reverse Voltage
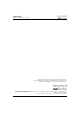
Fig. 1 - Maximum Forward Voltage Drop Characteristics
0.0001
0.001
0.01
0.1
1
10
100
0 5 10 15 20 25 30 35 40
R
R
125°C
100°C
75°C
50°C
25°C
Reverse Current - I (mA)
T = 150°C
J
Reverse Voltage - V (V)
10
100
0 5 10 15 20 25 30 35 40
T = 25°C
J
R
T
Junction Capacitance - C (pF)
Reverse Voltage - V (V)
T
J
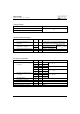
Max. Junction Temperature Range (*) - 55 to 150 °C
T
stg
Max. Storage Temperature Range - 55 to 150 °C
R
thJL
Max. Thermal Resistance Junction 35 °C/W DC operation (* See Fig. 4)
to Lead (**)
R
thJA
Max. Thermal Resistance Junction 80 °C/W DC operation
to Ambient
wt Approximate Weight 0.07(0.002) g (oz.)
Case Style SMA Similar D-64
Device Marking IR14
Thermal-Mechanical Specifications
Parameters Value Units Conditions
(**) Mounted 1 inch square PCB, Thermal Probe connected to lead 2mm from Package
Instantaneous Forward Current - I
F
(A)
Forward Voltage Drop - V
FM
(V)
0.1
1
10
0.2 0.4 0.6 0.8 1 1.2 1.4 1.6
Tj = 150˚C
Tj = 125˚C
Tj = 100˚C
Tj = 25˚C
< thermal runaway condition for a diode on its own heatsink
(*) dPtot 1
dTj Rth( j-a)