
Datasheet

5–3
ILD/Q1/2/5
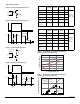
Typical Switching Times
Figure 1. Non-saturated switching timing
Figure 2. Non-saturated switching timing
Figure 3. Saturated switching timing
Figure 4. Saturated switching timing
V
O
V
CC
=5 V
R
L
=75 Ω
F=10 KHz,
DF=50%
I
F
=10 mA
I
F
V
O
t
D
t
R
50%
PHL
t
PLH
t
S
t
F
t
V
O
V
CC
=5
V
R
L
F=10 KHz,
DF=50%
I
F
=10 mA
I
F
V
O
t
D
t
R
V
TH
=1.5 V
t
PHL
t
PLH
t
S
t
F
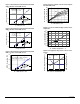
Figure 5. Normalized non-saturated and saturated
CTR at T
A
=25
°
C versus LED current
Figure 6. Normalized non-saturated and saturated
CTR at T
A
=25
°
C versus LED current
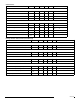
Characteristic ILD/Q1
I
F
=20 mA
ILD/Q2
I
F
=5 mA
ILD/Q5
I
F
=10 mA
Unit Condition
Delay, t
D
0.8 1.7 1.7
µ
s
V
CE
=5 V
R
L
=75 k
Ω
50% of V
PP
Rise time, t
R
1.9 2.6 2.6
µ
s
Storage, t
S
0.2 0.4 0.4
µ
s
Fall Time, t
F
1.4 2.2 2.2
µ
s
Propagation
H-L, t
PHL
0.7 1.2 1.1
µ
s
Propagation
L-H, t
PLH
1.4 2.3 2.5 µs
Characteristic ILD/Q1
I
F
=20 mA
ILD/Q2
I
F
=5 mA
ILD/Q5
I
F
=10 mA
Unit Condition
Delay, t
D
0.8 1 1.7
µs
V
CE
=0.4 V
R
L
=1 kΩ
V
CC
=5 V
V
TH
=1.5 V
Rise time, t
R
1.2 2 7
µs
Storage, t
S
7.4 5.4 4.6
µs
Fall Time, t
F
7.6 13.5 20
µs
Propagation
H-L, t
PHL
1.6 5.4 2.6
µs
Propagation
L-H, t
PLH
8.6 7.4 7.2
µs
.1 1 10 100
0.7
0.8
0.9
1.0
1.1
1.2
1.3
1.4
If - Forward Current - mA
Vf-Forward Voltage - V
Ta = -55°C
Ta = 25°C
Ta = 100°C
.1 1 10 100
0.0
0.5
1.0
1.5
NCTR(SAT)
NCTR
IF - LED Current - mA
CTRNF - Normalized CTR Factor
Normalized to:
Vce = 10V, IF = 10mA
Ta = 25°C
CTRce(sat) Vce = 0.4V