
User`s guide


52
Uncertainty Analysis
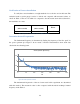
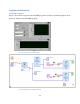
The uncertainty of natural frequency is 0.05 Hz, which is limited by the resolution of
spectral analyzer in LabVIEW program.
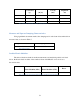
Uncertainty analyses with respect to the parameters are performed for damping ratio and
amplitude. Parameters used in the uncertainty analyses are shown in Table 9. Thickness, length
and gauge location are measured with a ruler, which has a least significant digit of
inch.
Therefore, the uncertainty for these three items is
inch, or
meter. An uncertainty
of 3% is assumed for measured strains.
Value
Uncertainty
Thickness (m)
Length (m)
0.27
Gauge Location (m)
0.0254
Natural frequency (Hz)
35
0.05
Strain (micro strain)
0 to
3%
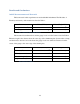
Table 8 Initial Values for Uncertainty Analysis
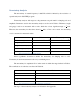
When logarithmic decrement is 0.043, the uncertainty for damping ratio is 9.9%.
Uncertainty in strain measurement is the only contributing factor.
The uncertainty for amplitude 25.2% when strain is within the range defined in Table 9.
The contributions of each factor are listed in Table 10.
Contribution
Thickness
98.5%
Strain
1.4%
Length
0.02%
Gauge location
0.02%
Table 9 Contributions of Parameters to Uncertainty in Amplitude
The steps of the uncertainty analysis are included in the Appendix.