
User`s guide


49
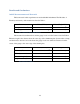
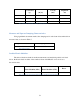
Verification of Correct Installation
To verify the correct installation, a weight attached close to the free end on the beam. The
analytical strain at strain gauge location is derived and compared with measured values, as
shown in Table 3. The error is within 3% compared to the theoretical strain derived, therefore,
the installation is correct.
Theoretical Strain
(micro strain)
Measured Strain
(micro strain)
Error
240.5
235
2.5%
Table 3 Comparison of Theoretical Strain and Measured Strain
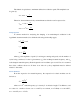
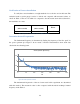
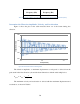
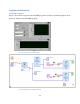
Determine Natural Frequencies
The fundamental frequency is determined by finding the frequency of the first “peak” in
the power spectrum plot. Figure 1 shows results of Fourier Transformation from strain data
obtained from a vibrating beam.
Figure 11 Power Spectrum of Strain
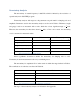
The fundamental frequencies of the two beams used in this experiment are determined
with this method. The measured value is then compared with theoretical undamped natural
frequency in the Table 4.
-80
-40
0
40
0 50 100 150 200 250 300
Hz
Strain (Power Spectrum)