
User`s guide

18
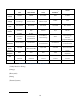
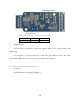
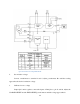
Figure 2 DATAQ’s Signal Response to Shunt Resistor
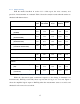
With the method described in section 3.1.2 of this report, the noise, accuracy, and are
evaluated with actual strain of known values. Table 4 and Table 5 show the analysis results.
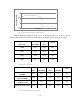
Table 4 Accuracy Test Result
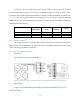
Table 5 Output Noise of Signal Conditioners
-0.5
0
0.5
1
0 5 10 15 20 25
Amplifiied Signal (V)
Time (s)
Applied Load
(micro strain)
Omega
DMD-465WB
Honeywell
UV-10
Tacuna
266.8
265.7
258.9
259.6
240.5
234.9
225.3
234
213.7
209.8
207.9
208.7
Error
2%
4%
2.5%
Vishay
2310
Omega
DMD-465WB
Honeywell
UV-10
DATAQ
DI5B38-04
Tacuna
Output Noise
(mV-RMS)
0.30
0.55
0.72
1.25
0.14
Output Noise
(microstrain-RMS)
0.30
0.69
0.75
2.19
0.16
Output Noise
(mV-Peak to Peak)
2.38
4.43
5.77
10.05
1.10
Output Noise
(microstrain- Peak to Peak)
2.38
5.53
6.05
17.54
1.27