
User`s guide

17
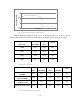
4.1.2 Output Testing
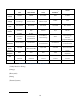
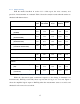
With the method described in section 3.1.2 of this report, the noise, accuracy, and
precision of measurements are evaluated. Table 3 shows the analysis results when the strains are
simulated with shunt resistors.
Vishay
2310
Omega
DMD-465WB
Honeywell
UV-10
DATAQ
DI5B38-04
Tacuna
Noise
Output Noise
(mV RMS)
0.24
2.46
2.14
4.99
0.18
Output Noise
(microstrain RMS)
0.24
3.94
4.09
11.44
0.31
Output Noise
(mV Peak-to-Peak)
1.93
19.71
16.8
39.95
1.44
Output Noise
(microstrain Peak-to-Peak )
1.93
31.49
32.7
91.54
2.48
Accuracy
Maximum Error
2.6%
9.3%
2.9%
12.5%
3.5%
Average Error
1.7%
7.1%
1.7%
9.7%
2.1%
Precision
Standard Deviation of Readings*
(mV)
0.65
0.36
0.54
4.55
3.90
Standard Deviation of Readings*
(microstrain)
0.65
0.57
1.04
10.43
6.77
Table 3 Shunt Resistor Testing Result for Signal Conditioners
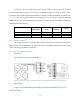
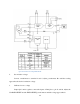
While the other tested signal conditioners responses to the change in simulated load
instantaneously, DATAQ occasionally shows response time as long as 3 to 5 seconds. Figure 2
shows the amplified signal output of DATAQ when the measurement starts at second 0, and
simulated load is removed at second 10.