
User`s guide


132
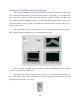
Go to Front Panel and configure the three Waveform Graphs. Replace the default axis
labels with appropriate names (left clicking on the label texts enables editing). Make the
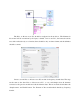
mapping of Y axis on the Frequency Domain-Log graph “Logarithmic”; the menu is accessed by
right clicking anywhere on the module.
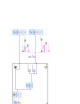
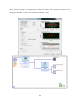
Create a Write to Measurement File module outside of the While Loop. Drag down the
downward arrow to show the input and outputs of the module. Extend the Dynamic Data wire
for the time domain data out of the While Loop and connect it to the signals input. Create a
control for the “Enable” input, and rename the button “Enable Write to File”. The Filename can
be constructed with Build Path function. It builds the file path with an Application Directory
function, which points to the folder where the VI is saved, and a Concatenated String (Use
Concatenate String function in String Palette) which consists of the lab name, the text “time
domain data”, the user inputted sample name, and a “.csv” (comma separated values) as file
extension, so that the data file can be opened with Microsoft Excel.