
Specifications


41
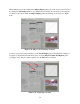
Multiple object tracks can be visualized simultaneously by clicking the Select Histogram
Range button. Crosshairs will appear and two clicks in the Graph Display panel will set the
lower and upper limits of the tracks to be displayed. The Single Variable Plot panel options will
be applied to plot each of the tracks resulting in a joint visualization of vehicle tracks (see Figure
6.50).
Figure 6.50. Multiple vehicle graph based on selected histogram range
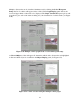
A Selected Object toolbar will appear. It determines which of the object tracks are highlighted
in blue and which object is visualized in the Object Display panel (see Figure 6.51).
Figure 6.51. Vehicle selection using the multiple vehicle graph