
Specifications


40
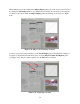
The plots in the Graph Display panel can show either filtered and corrected or unfiltered and
uncorrected data depending on the Use Equalized Length Data button state (see Figure 6.48).
Figure 6.48. Visualization with and without shape correction and filtering
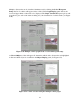
Histograms of data can be plotted in the Graph Display panel using the options available in the
Histogram Options panel (see Figure 6.49). The Area, Time, and Range slider bars set
minimum values that filter out data from the histogram. A histogram is plotted by selecting a
variable in the selection box and clicking the Create Histogram button.
Figure 6.49. Histogram generation