PC Scopes PCS500 PCS100 / K8031 CHECK THE Pc-Lab2000 T M GETTING STARTED GUIDE FOR SOFTWARE INSTALLATION Reference Manual
PCS500 / PCS100 / K8031 VELLEMAN Instruments is a division of VELLEMAN Components NV Legen Heirweg 33 9890 Gavere Belgium Support & updates : http://www.Velleman.
PCS500 / PCS100 / K8031 FCC information for the USA This equipment has been tested and found to comply with the limits for a Class B digital device, pursuant to Part 15 of the FCC Rules. These limits are designed to provide reasonable protection against harmful interference in a residential installation. This equipment generates, uses and can radiate radio frequency energy and, if not installed and used in accordance with the instructions, may cause harmful interference to radio communications.
PCS500 / PCS100 / K8031 GENERAL The PCS500 / PCS100 / K8031 are digital storage oscilloscopes, using a computer and its monitor to display waveforms. All standard oscilloscope functions are available in the Windows program supplied. Its operation is just like a normal oscilloscope with the difference that most operations can be done using the mouse. The markers for indicating voltage and frequency also provide considerable ease of use and can be operated without difficulty using the mouse.
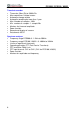
PCS500 / PCS100 / K8031 Minimum system requirements • • • • • • IBM compatible PC Windows 95, 98, ME, (Win2000 or NT possible) SVGA display card (min.
PCS500 / PCS100 / K8031 Transient recorder • Timescale: 20ms/Div to 2000s/Div • Max record time: 9.4hour/screen • Automatic storage of data • Automatic recording for more than 1 year • Max. Number of samples: 100/s • Min. number of samples: 1 sample/20s • Markers for time and amplitude • Zoom function • Record and display of screens • Data format: ASCII Spectrum analyser • Frequency range PCS500: 0.. 1.2kHz to 25MHz • Frequency range PCS100 / K8031: 0..
PCS500 / PCS100 / K8031 SAFETY and WARNINGS Symbols displayed on the unit ! Important safety information, see user manual. The PC scopes are optically isolated from the PC, but even then it is advisable to measure only safe devices. ⇒ Measurements should be avoided in case of polluted or very humid air. ⇒ ⇒ ⇒ ⇒ One should also refrain from measuring conductors or installations that use voltages that exceed 600Vrms above ground level.
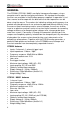
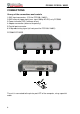
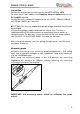
PCS500 / PCS100 / K8031 CONNECTIONS Survey of the connections and controls 1.BNC input connectors (1CH for PCS100 / K8031) 2.BNC external trigger input (max. input 100Vp AC+DC) only PCS500 3.Power indication LED (software driven) 4.Adapter connection (observe the polarity!) 5.Parallel port connector 6.X10 probe testing signal (at front panel for PCS100 / K8031) PCS500 PICTURES 1 6 3 2 5 1 4 The unit is connected to the printer port LPT of the computer, using a parallel cable.
PCS500 / PCS100 / K8031 Connection Connect the oscilloscope unit to the printer port LPT1, LPT2 or LPT3. To select the LPT port address click Hardware Setup on Options menu or run Pc-Lab2000 software. Connect the mains voltage DC adapter to the unit : 9VDC / 1000mA. (500mA for PCS100 / K8031) (pin = positive). MATTENTION: Only use adapter with correct voltage otherwise the unit could be damaged. Using a wrong power supply could blow the internal fuse.
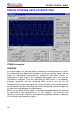
PCS500 / PCS100 / K8031 DIGITAL STORAGE OSCILLOSCOPE "DSO" PCS500 screenshot PURPOSE An oscilloscope is an indispensable instrument for viewing electrical signals. The advantage of a digital oscilloscope is that the measured signals can be frozen for subsequent examination or comparison with other signals. In digitizing the signal there is the additional advantage that it can also be scientifically analyzed.
PCS500 / PCS100 / K8031 SPECTRUM ANALYZER "FFT" PCS500 screenshot PURPOSE Only one fundamental frequency of a signal can be properly measured using an oscilloscope, the levels of other frequencies cannot be easily examined and compared simultaneously. The spectrum analyzer is the solution to this problem. Because the incoming signal is digitized, it is possible for the signal to be scientifically converted into its frequency spectrum (using FFT - Fast Fourier Transforms).
PCS500 / PCS100 / K8031 SOFTWARE CONTROLS Remarks: • Due to software upgrades, the actual menus can differ from the ones described in this manual, please also refer to the Help file (English only) • PCS100 / K8031 has only one channel and no external trigger input All modules: How to add a comment in the signal screen: Right mouse Click into the screen Text box will open, to write your comment: Click “Add text on the screen” or “Remove” to remove previously inserted text.
PCS500 / PCS100 / K8031 TIME/DIV Selects the time setting for the beam to sweep one major division on the screen. By selecting different TIME/DIV settings it is possible to zoom the frozen waveform on the screen. TRIGGER On/Off Selects free run mode or trigged mode. TRIGGER Level Selects the signal level at which the sweep is triggered. Triggering reference mark is displayed with the horizontal line on the left side of the screen.
PCS500 / PCS100 / K8031 1GS/s sampling mode (not for PCS100 / K8031) This 1GS/s sampling rate is in use on 0.2us/div, 0.1us/div, 0.05us/div and 0.02us/div ranges. Triggering must be ON to get stable waveform images. This mode is useable only for repetitive signals. This operation mode is called "Random Interleaved Sampling" (RIS) method, sometimes also called "Equivalent Time Sampling" (ET) mode or "Random Repetitive Sampling".
PCS500 / PCS100 / K8031 Spectrum analyzer mode (FFT) FREQ. RANGE Sets the frequency range of the display. It is necessary to slide the screen using X-POSITION in order to see the full range. LOG/LIN To display the frequency on a linear or logarithmic scale.
PCS500 / PCS100 / K8031 Menu Options (some options depend on selected module) File Menu Open Image Opens an image file and displays it on the screen. Open DSO Data Opens and displays the waveform data saved in text format using the Save DSO Data option. Save Image Saves the image to a file in Windows Bitmap (*.BMP) format. Image is saved in gray scale. Use Edit/Copy menu to get full color images to other applications. Save DSO Data Saves the waveform data in text format.
PCS500 / PCS100 / K8031 Edit Menu Copy Copies the image to the Windows' clipboard. Paste Pastes the image residing in Windows' clipboard to the screen. Options Menu FFT Window Spectrum analyzer supports five different FFT windows It is common practice to taper the original signal before calculating the FFT (Fast Fourier Transformation). This reduces any discontinuities at the edges of the signal. This is done by multiplying the signal with a suitable window function. 1. 2. 3. 4. 5.
PCS500 / PCS100 / K8031 Colors Select the color for various items on the waveform display. To change the color of an item, click the corresponding button. This will open a dialog in which you can select the new color. Full color selection is possible only if True Color (24 bit) palette is used. There are restrictions in the color combinations with other palettes. Click Default Colors button to resets all colors to the default settings.
PCS500 / PCS100 / K8031 Math Menu (not for PCS100 / K8031) The result of mathematical operation of channel 1 and 2 is displayed. One of the following functions can be selected: Ch1 + Ch2 Ch1 - Ch2 XY Plot Invert Ch2 XY Plot: Ch1 data is displayed on Y-axis Ch2 data is displayed on X axis A button is provided to toggle between Math mode and Normal mode.
PCS500 / PCS100 / K8031 TRANSIENT SIGNAL RECORDER "REC" PCS500 screenshot (1CH only for PCS100 / K8031) PURPOSE If short one time changes are to be recorded, then it is best to use a transient recorder. This device can best be compared to a tape recorder, but is used for recording electrical signals. The signal recorder is nothing other than an oscilloscope with a very slow time base.
PCS500 / PCS100 / K8031 SOFTWARE CONTROLS Remark: • Due to software upgrades, the actual menus can differ from the ones described in this manual, please also refer to the Help file (English o nly) • PCS100 / K8031 has only one channel and no external trigger input VOLTS/DIV Selected value indicates the peak-to-peak voltage required to produce a peakto-peak deflection of one major division on the screen. CH1, CH2 Buttons turn the display of the trace ON or OFF.
PCS500 / PCS100 / K8031 Menu Options File Menu Note: Default subdirectory (folder) /DATA for image and data files is created when program is run the first time. Open Image Opens an image file and displays it on the screen. Open Data Opens and displays the waveform data saved in text format using the Save Data option. Save Image Saves the image to a file in Windows Bitmap (*.BMP) format. Image is saved in gray scale. Use Edit/Copy to get full color images to other applications.
PCS500 / PCS100 / K8031 View Menu Markers Two horizontal markers for measuring voltage Note: The voltage markers give preference to channel Ch1 if both channels are being used. Two vertical markers for measuring time Marker function for absolute and relative time measurement is provided. If V & t markers are selected the absolute time of the marker position is displayed. If V & dt markers are selected the time difference between the markers is displayed.
PCS500 / PCS100 / K8031 Troubleshooting No signal on the oscilloscope display No communication with the computer (check that the cable is connected to parallel printer port (LPT) Check the printer port setting in the BIOS SETUP of the computer. Select standard parallel port mode (SPP), also named "compatible" mode or "Centronics" mode. • • • • • • • Program is not in RUN ON The channel concerned is OFF TIME/DIV switch is in the wrong setting.
PCS500 / PCS100 / K8031 WARRANTY This product is guaranteed against defects in components and construction from the moment it is purchased and for a period of ONE YEAR starting from the date of sale. This guarantee is only valid if the unit is submitted together with the original purchase invoice. VELLEMAN Components limits its responsibility to the reparation of defects or, as VELLEMAN Components deems necessary, to the replacement or reparation of defective components.